
2021년 2월 4일 모바일 게임 매출 순위
| Rank | Game | Publisher |
|---|---|---|
| 1 | 리니지M | NCSOFT |
| 2 | 리니지2M | NCSOFT |
| 3 | 그랑사가 | NPIXEL |
| 4 | 세븐나이츠2 | Netmarble |
| 5 | Cookie Run: Kingdom | Devsisters Corporation |
| 6 | 기적의 검 | 4399 KOREA |
| 7 | R2M | Webzen Inc. |
| 8 | 바람의나라: 연 | NEXON Company |
| 9 | A3: 스틸얼라이브 | Netmarble |
| 10 | 블레이드&소울 레볼루션 | Netmarble |
| 11 | V4 | NEXON Company |
| 12 | 라이즈 오브 킹덤즈 | LilithGames |
| 13 | Genshin Impact | miHoYo Limited |
| 14 | 메이플스토리M | NEXON Company |
| 15 | FIFA ONLINE 4 M by EA SPORTS™ | NEXON Company |
| 16 | 미르4 | Wemade Co., Ltd |
| 17 | 리니지2 레볼루션 | Netmarble |
| 18 | 뮤 아크엔젤 | Webzen Inc. |
| 19 | Pmang Poker : Casino Royal | NEOWIZ corp |
| 20 | S.O.S:스테이트 오브 서바이벌 | KingsGroup Holdings |
| 21 | 찐삼국 | ICEBIRD GAMES |
| 22 | Brawl Stars | Supercell |
| 23 | 검은강호2: 이터널 소울 | 9SplayDeveloper |
| 24 | KartRider Rush+ | NEXON Company |
| 25 | 가디언 테일즈 | Kakao Games Corp. |
| 26 | Lords Mobile: Kingdom Wars | IGG.COM |
| 27 | Cookie Run: OvenBreak – Endless Running Platformer | Devsisters Corporation |
| 28 | Roblox | Roblox Corporation |
| 29 | Summoners War | Com2uS |
| 30 | PUBG MOBILE | KRAFTON, Inc. |
| 31 | 한게임 포커 | NHN BIGFOOT |
| 32 | AFK 아레나 | LilithGames |
| 33 | Age of Z Origins | Camel Games Limited |
| 34 | 프린세스 커넥트! Re:Dive | Kakao Games Corp. |
| 35 | 블리치: 만해의 길 | DAMO NETWORK LIMITED |
| 36 | Dungeon Knight: 3D Idle RPG | mobirix |
| 37 | Gardenscapes | Playrix |
| 38 | FIFA Mobile | NEXON Company |
| 39 | Empires & Puzzles: Epic Match 3 | Small Giant Games |
| 40 | 라그나로크 오리진 | GRAVITY Co., Ltd. |
| 41 | Homescapes | Playrix |
| 42 | 한게임포커 클래식 with PC | NHN Corp. |
| 43 | Top War: Battle Game | Topwar Studio |
| 44 | 갑부: 장사의 시대 | BLANCOZONE NETWORK KOREA |
| 45 | Epic Seven | Smilegate Megaport |
| 46 | 뮤오리진2 | Webzen Inc. |
| 47 | 검은사막 모바일 | PEARL ABYSS |
| 48 | 리니지M(12) | NCSOFT |
| 49 | 그랑삼국 | YOUZU(SINGAPORE)PTE.LTD. |
| 50 | 슬램덩크 | DeNA HONG KONG LIMITED |
Deploy Your Jupyter Notebooks the Easy Way — Python Edition -번역
바인더 저장소를 사용하여 노트북 배포
쉬운 방법으로 Jupyter 노트북 배포 — Python 에디션
간단한 7 단계를 통해 다른 사람의 컴퓨터에서 Jupyter 노트북을 실행하세요.
Intro
이 기사에서 나는 당신이 결코 말하지 않도록 도울 것입니다.
“하지만… 내 노트북에서 작동했습니다 😥”다시 한번.
간단한 7 단계로 노트북을 배포하는 방법을 보여 드리겠습니다. 😄.
이것을 상상하십시오.Jupyter 노트북에서 멋진 머신 러닝 파이프 라인을 구축하는 데 시간을 보냈습니다.컴퓨터에서 끝까지 실행되며 이제 상사 또는 LinkedIn 네트워크와 공유하여 얼마나 멋진 지 보여주고 싶습니다.
“이것은 쉬운 부분입니다”, 당신은 순진하게 자신에게 말합니다.
“이메일에 첨부하거나 노트북을 보관하고있는 GitHub 저장소에 링크를 게시하겠습니다.
만약 당신이 b이자형jw.org ko이 상황에서 작업을 공유하려는 좌절감을 알게 될 것입니다.
직면했을 가능성이있는 합병증 목록은 다음과 같습니다.
😡 라이브러리 종속성으로 인해 노트북 오류의 코드.
😡 사용자가 노트북과 상호 작용할 수 없습니다.
😡 노트북에 사용 된 데이터는 로컬 컴퓨터에 있습니다.
좋은 소식은 실제로 Jupyter 노트북을 배포하고 이러한 모든 일반적인 문제를 피할 수있는 놀랍도록 간단하고 무료 인 방법이 있다는 것입니다.또한 소프트웨어 엔지니어링 전문가 일 필요도 없습니다.
👍Binder Repositories로 노트북을 배포 할 수 있습니다.
자세한 내용을 살펴보기 전에 바인더 저장소에 대해 간략히 살펴 보겠습니다.
바인더 저장소 란 무엇입니까?
바인더는 최소 두 가지 요소를 포함하는 코드 저장소입니다.
☑️ 사람들이 실행할 수 있도록하려는 코드 또는 콘텐츠.우리의 목적을 위해 이것은 Jupyter 노트북이 될 것입니다.
☑️ 환경에 대한 구성 파일.바인더는 코드를 실행하는 데 필요한 환경을 구축하는 데 사용됩니다.
좋은 점은 Jupyter 노트북을 쉽게 배포 할 수있는 온라인 오픈 소스 바인더 저장소 서비스가 있다는 것입니다.
이 자습서에서는 My Binder를 사용합니다.바인더 서비스 및 BinderHub 기술 시연의 역할을하는 바인더 커뮤니티에서 유지 관리하는 사용하기 쉬운 서비스입니다.
시작하자!
전제 조건
이 자습서는 Python 기반 Jupyter 노트북 배포에 중점을 둡니다.따라서 독자가 이미 Jupyter 노트북에 익숙하다고 가정하겠습니다.
GitHub 계정이 필요합니다.사용 된 모든 csv / 데이터를 포함하여 프로젝트를 저장합니다.GitHub 계정이없는 경우 계속하기 전에 계정을 만들어야합니다.
노트북 배포
배포 자습서를 위해 일부 데이터를 표시하는 작은 Jupyter 노트북을 만들었습니다.GitHub에서 사용할 수 있도록하겠습니다.
1 단계 — 프로젝트를 보관할 GitHub 리포지토리를 만들고 원하는대로 GitHub 리포지토리의 이름을 지정할 수 있습니다.
저는 “deploy_notebook_example”이라고 불렀습니다 (… 매우 창의적입니다).
2 단계 — 다음 코드를 사용하여 Jupyter 노트북을 만듭니다.
첫 번째 코드는 GitHub 저장소에서 CSV 파일을 읽는 함수입니다.저장소의 데이터 파일 위치로 URL을 변경해야합니다.
3 단계 — 요구 사항 텍스트 파일을 만들고 GitHub에 업로드합니다.
이 파일에는 Jupyter 노트북에 대한 모든 라이브러리 종속성이 포함되어 있습니다.이것이 바인더가 노트북이 다른 사람의 컴퓨터에서 원활하게 실행되는 데 필요한 환경을 재현하기 위해 설치할 라이브러리를 파악하는 방법입니다.
이를 수행하는 가장 쉬운 방법은 “핍 동결“Jupyter 노트북에서.그러면 환경에 설치된 모든 라이브러리가 표시됩니다.노트북에서 사용한 라이브러리를 메모장에 복사하여 붙여넣고 “요구 사항”으로 저장하기 만하면됩니다.
라이브러리에도 버전이 포함되어 있어야합니다.
올바르게 완료되면 요구 사항 파일은 다음과 같아야합니다.
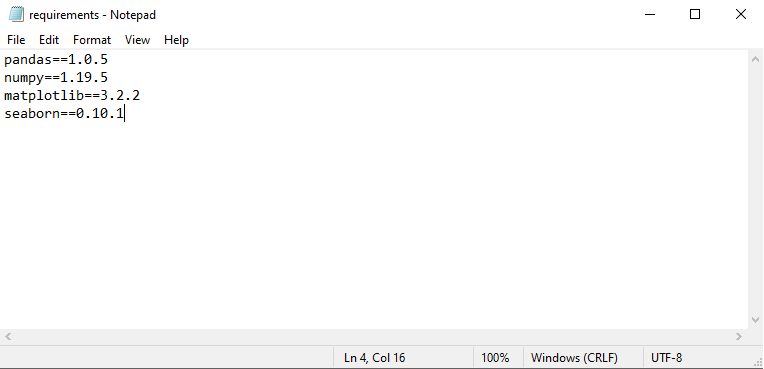
⭐ 노트북으로 가져온 라이브러리 만 복사해야합니다!
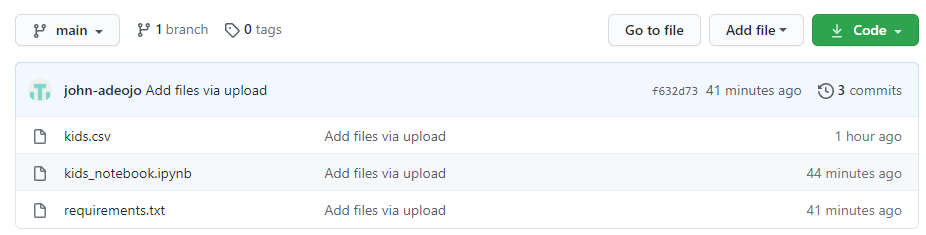
4 단계 — Jupyter 노트북, csv 파일, 요구 사항 텍스트 파일을 GitHub 저장소에 업로드합니다.
GitHub 저장소는 다음과 같아야합니다.
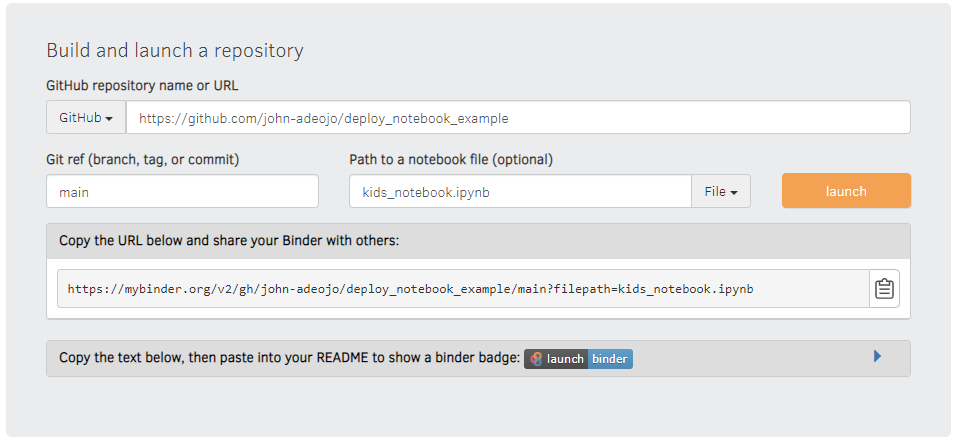
5 단계 — 내 바인더로 이동
프로젝트가 포함 된 저장소의 GitHub URL을 창에 붙여 넣습니다.
Git 참조 유형이라고 표시된 곳본관.
노트북 파일 이름에 노트북 유형의 경로가 표시됩니다.GitHub 저장소에서 노트북을 클릭하고 파일 경로를 복사하여 노트북 파일 이름을 얻을 수 있습니다.
이 작업이 완료되면시작하다단추.My Binder는 몇 분 안에 바인더 저장소를 구성합니다.
빌드가 완료되면 컴퓨터에서 프로젝트를 실행하려는 모든 사람과이 링크를 공유 할 수 있습니다.
🚀 바인더 버튼을 클릭하여 링크를 잡으세요!
Step 6 — Grab your Binder link and share it with the world!
Step 7 — Celebrate
그것이 쉬웠다는 것을 알 수 있으며 “하지만… 내 노트북에서 작동했다”고 다시는 말할 필요가 없을 것입니다.
🌈 이것이 도움이 되었다면 피드백을 남기거나 Jupyter 노트북을 선보이고 싶은 친구와 공유하십시오.
감사
Deploy Your Jupyter Notebooks the Easy Way — Python Edition
Using Binder Repos to deploy notebooks
Deploy Your Jupyter Notebooks the Easy Way — Python Edition
Get your Jupyter notebooks running on someone else’s machine in 7 easy steps
Intro
In this article I going to help you never say —
“But…it worked on my laptop 😥” ever again.
I’ll show you how to deploy your notebooks in 7 easy steps 😄.
Picture this. You’ve spent time building an awesome machine learning pipeline in a Jupyter notebook. It runs end to end on your computer, and now you want to share it with your boss or LinkedIn network to show how awesome you are.
“This is the easy part”, you say to yourself naively.
“I’ll just attach this to an email or post a link to a GitHub repository holding the notebook and….voila”.
If you’ve ever been in this situation, you’ll know the frustrations of trying to share your work.
The list of likely complications you would have faced are:
😡 The code in the notebook errors due to library dependencies.
😡 The user is not able to interact with the notebook.
😡 The data used in the notebook is sat on your local machine.
The good news is there is actually an amazingly simple (and free) way to deploy your Jupyter notebooks and avoid all of these common issues. And, you don’t have to be a software engineering whiz either.
👍We can deploy our notebooks with Binder Repositories.
Before getting into the details, let’s talk briefly about binder repositories.
What is a Binder Repository?
A Binder is a code repository that contains at minimum two elements:
☑️Code or content that you want people to be able to run. For our purposes this will be a Jupyter notebook
☑️ Configuration files for the environment. These are used by the binder to build the environment required for the code to run.
The great thing is there are online, open source, binder repo services that make deploying your Jupyter notebooks easy.
For this tutorial we will be using My Binder. An easy-to-use service that is maintained by the Binder community, serving as both a binder service and a demonstration of the BinderHub tech.
Let’s get started!
Pre-requisites
This tutorial is focused on deploying python based Jupyter notebooks. Therefore, I’ll assume the reader is already familiar with Jupyter notebooks.
You’ll need a GitHub account to store your project, including any csv/data used. If you don’t have a GitHub account, you should create one before proceeding.
Deploy Your Notebook
I have created a small Jupyter notebook that plots some data for our deployment tutorial. I’ll make this available on GitHub.
Step 1 — Create a GitHub repository to hold the projects, you can name your GitHub repo as you like.
I’ve called mine “deploy_notebook_example” (…very creative, I know).
Step 2 — Create a Jupyter notebook with the following code:
The first piece of code is a function that reads CSV files from a GitHub repository. You’ll need to change the url to the location of your data files in your repository.
Step 3 — Create a requirements text file and upload to GitHub.
This file contains all the library dependencies for your Jupyter notebook. It’s how the Binder will know what libraries to install to recreate the environment needed for your notebook to run smoothly on someone else’s machine.
The easiest way to do this is by running “pip freeze” in your Jupyter notebook. This will show you all the libraries installed in your environment. Simply copy and paste the libraries you have used in your notebook into a notepad and save as “requirements”.
Note it’s important that the libraries include the version too.
If done correctly, your requirements file should look like this:
⭐You should only copy the libraries you have imported to the notebook!
Step 4 — Upload your Jupyter notebook, your csv file, and your requirements text file to your GitHub repo.
Your GitHub repo should look something like this.
Step 5 — Got to My Binder
Paste the GitHub URL for your repository containing the project into the window.
Where it says Git ref type in main.
Where it says path to notebook type in the notebook file name. You can get the notebook file name by clicking on the notebook in your GitHub repository and copying the file path.
Once this is done simply hit the launch button. My Binder will construct your binder repo in a few minutes.
Once built, you can share the link to this with anybody you want to run your project on their machine.
🚀 Grab your link by clicking the binder button!
Step 6 — Grab your Binder link and share it with the world!
Step 7 — Celebrate
See that was easy, and hopefully you’ll never have to say “But…it worked on my laptop” ever again.
🌈 If you found this helpful, please leave some feedback or share with a friend who wants to showcase their Jupyter notebook.
Thanks
2021년 2월 3일 모바일 게임 매출 순위
| Rank | Game | Publisher |
|---|---|---|
| 1 | 리니지M | NCSOFT |
| 2 | 리니지2M | NCSOFT |
| 3 | 그랑사가 | NPIXEL |
| 4 | 세븐나이츠2 | Netmarble |
| 5 | Cookie Run: Kingdom | Devsisters Corporation |
| 6 | 기적의 검 | 4399 KOREA |
| 7 | 바람의나라: 연 | NEXON Company |
| 8 | R2M | Webzen Inc. |
| 9 | 블레이드&소울 레볼루션 | Netmarble |
| 10 | A3: 스틸얼라이브 | Netmarble |
| 11 | V4 | NEXON Company |
| 12 | 라이즈 오브 킹덤즈 | LilithGames |
| 13 | 미르4 | Wemade Co., Ltd |
| 14 | 메이플스토리M | NEXON Company |
| 15 | FIFA ONLINE 4 M by EA SPORTS™ | NEXON Company |
| 16 | Genshin Impact | miHoYo Limited |
| 17 | 뮤 아크엔젤 | Webzen Inc. |
| 18 | Pmang Poker : Casino Royal | NEOWIZ corp |
| 19 | 리니지2 레볼루션 | Netmarble |
| 20 | S.O.S:스테이트 오브 서바이벌 | KingsGroup Holdings |
| 21 | 찐삼국 | ICEBIRD GAMES |
| 22 | Brawl Stars | Supercell |
| 23 | 검은강호2: 이터널 소울 | 9SplayDeveloper |
| 24 | KartRider Rush+ | NEXON Company |
| 25 | Lords Mobile: Kingdom Wars | IGG.COM |
| 26 | 가디언 테일즈 | Kakao Games Corp. |
| 27 | Cookie Run: OvenBreak – Endless Running Platformer | Devsisters Corporation |
| 28 | Roblox | Roblox Corporation |
| 29 | PUBG MOBILE | KRAFTON, Inc. |
| 30 | 한게임 포커 | NHN BIGFOOT |
| 31 | AFK 아레나 | LilithGames |
| 32 | Summoners War | Com2uS |
| 33 | Age of Z Origins | Camel Games Limited |
| 34 | 프린세스 커넥트! Re:Dive | Kakao Games Corp. |
| 35 | 블리치: 만해의 길 | DAMO NETWORK LIMITED |
| 36 | Dungeon Knight: 3D Idle RPG | mobirix |
| 37 | Gardenscapes | Playrix |
| 38 | FIFA Mobile | NEXON Company |
| 39 | Empires & Puzzles: Epic Match 3 | Small Giant Games |
| 40 | Homescapes | Playrix |
| 41 | 라그나로크 오리진 | GRAVITY Co., Ltd. |
| 42 | 한게임포커 클래식 with PC | NHN Corp. |
| 43 | Top War: Battle Game | Topwar Studio |
| 44 | 갑부: 장사의 시대 | BLANCOZONE NETWORK KOREA |
| 45 | Epic Seven | Smilegate Megaport |
| 46 | 검은사막 모바일 | PEARL ABYSS |
| 47 | 리니지M(12) | NCSOFT |
| 48 | 그랑삼국 | YOUZU(SINGAPORE)PTE.LTD. |
| 49 | 컴투스프로야구2021 | Com2uS |
| 50 | Clash of Clans | Supercell |
Players, Positions, and Probability in the NBA -번역
NBA의 선수, 위치 및 확률
지도 머신 러닝을 사용하여 NBA 위치 분류기 구축
중요한 질문으로이 블로그를 시작하겠습니다. NBA 선수를 위치별로 분류하기 위해 기계 학습을 사용해야하는 이유는 무엇입니까?평범한 농구 팬이라면 어느 선수가 어떤 포지션을하는지 식별 할만큼 충분히 농구를봤을 것입니다.게임에 대한 지식이없는 사람이라도 각 위치가하는 일을 이해하기 위해 역대 최고의 유튜브 클립을 찾을 수 있습니다.그렇다면 기계 학습 알고리즘이 그 사용을 정당화하는 추가 정보를 제공 할 수 있습니까?
글쎄, 올 때티o 분류 작업에서 기계 학습 알고리즘은 예측 된 확률을 사용하여 그룹에 속하는지 여부를 결정합니다. NBA 포지션의 경우 머신 러닝 알고리즘은 플레이어가 포인트 가드, 슈팅 가드, 스몰 포워드, 파워 포워드 또는 센터 일 확률을 예측합니다. 알고리즘은 주어진 플레이어의 각 위치에 대한 확률을 제공합니다. NBA 분석가 간의 토론이나 프론트 오피스에 유용 할 수있는 것은 바로 이러한 확률입니다. 새로운 세대의 NBA 재능이있을 때마다 선수들의 스킬 세트와 관련하여 더 많은 하이브리드 화를 보았습니다. 센터는 더 이상 화면을 설정하기 위해 3 포인트 라인에만 오는 바스켓에 엄격하게 가까운 로우 포스트 플레이어가 아닙니다. 현대 센터는 3 점 선으로 이동하여 3 점을 가져오고 일부는 빠른 휴식을 효과적으로 실행하는 데 필요한 기술을 갖추고 있습니다. 플레이어에게 할당 된 위치 확률을 통해 플레이어의 다양성을 이해하기 시작할 수 있습니다. 팀 내 각 선수의 위치 확률을 알고 있다면 자신의 팀이나 상대의 라인업 분석에 사용할 수 있습니다.
이러한 위치 확률에 대한 또 다른 용도를 고려해 보겠습니다.매년 스포츠 작가와 방송인 패널이 가장 가치있는 선수, 올해의 수비 선수, 모든 NBA 팀과 같은 다양한 상을 위해 투표합니다.당조hoopsrumors.com에서 플레이어는 다음 기준을 충족하는 경우 슈퍼 맥스 계약 (팀 연봉 한도의 30 %)을받을 수 있습니다.
- 이전 시즌 또는 이전 시즌 3 개 중 2 개에서 All-NBA 팀을 구성합니다.
- 이전 시즌 또는 이전 시즌 3 개 중 2 개에서 올해의 수비 선수로 선정
- 이전 세 시즌 중 최소 한 번에 가장 가치있는 선수로 선정
이러한 미디어 회원의 투표가 플레이어의 향후 수익에 영향을 미칠 수 있다는 점을 감안할 때 플레이어를 평가하고 비교할 때 공평한 메트릭을 갖는 것이 무엇보다 중요합니다.NBA 위치 분류 알고리즘에 대한 입력은 플레이어의 성능과 게임에 미치는 영향을 설명하는 기록 된 통계 그룹입니다.그런 다음 알고리즘은 이러한 입력을 받아 어떤 종류의 수학을 수행하고 위치 확률을 제공합니다.입력으로 올바른 가정을하고 모델을 적절하게 훈련한다고 가정하면 다음과 같은 것을 생성 할 수 있습니다.

두 명의 잠재적 MVP 후보 중에서 결정하는 경우 수상 유권자는 위에 표시된 것과 같은 도구를 사용하여 위치 다양성이 더 큰 플레이어와 함께 가기로 결정할 수 있습니다.
데이터 수집
위에 표시된 확률을 생성 할 수있는 모델을 만들려면 먼저 각 플레이어에 대한 데이터를 수집해야합니다.소유 통계 100 개당과고급 통계basketball-reference.com에서 수집되었습니다.플레이어 추적 데이터는 stats.nba.com에서nba_stats_trackingPython 용 라이브러리.이 라이브러리에 대한 문서를 찾을 수 있습니다.여기. 2015–16에서 2018–19 시즌의 선수 데이터 만 사용되었습니다. COVID-19로 인한 갑작스러운 정지와 플레이 한 정규 시즌 총 횟수가 일치하지 않아 2019-20 플레이어 데이터를 사용하지 않기로 결정했습니다. NBA 웹 사이트의 선수 추적 데이터는 2013–2014 시즌으로 거슬러 올라갑니다. 곧 보게 되겠지만 NBA는 샷 선택에있어서 약간의 발전을 거쳤습니다. NBA의 모든 팀에서 시도하고 만든 3 개의 포인터 수가 크게 증가했습니다. 3 포인트 시대에 해당하는 4 시즌의 데이터를 사용하여 해마다 통계적 차이로 인해 모델이 플레이어에 대해 잘못된 가정을하는 것을 방지하는 것이 제 목표였습니다. 정규 시즌 데이터 만 사용되었습니다. 다른 소스는 플레이어 이름과 시즌을 사용하여 단일 Pandas 데이터 프레임으로 결합되었습니다. 각 플레이어는 단일 관찰로 취급되었습니다 (예 : 2015–16 LeBron James는 2017–18 LeBron James와 다릅니다). 나는 세 가지 이유로 각 플레이어를 단일 관찰로 취급하기로 결정했습니다.
- 모델 학습 및 테스트에 충분한 데이터가 있는지 확인하려면
- 명단은 해마다 거의 동일하지 않습니다.드래프트, 트레이드 또는 자유 에이전시 출신이든 새로운 선수를 소개하면 코치가 라인업을 조정해야 할 수 있으며 선수들은 팀 성공을 위해 자신의 플레이를 변경할 수 있습니다.
- 다른 모든 사람들과 마찬가지로 NBA 선수는 매년 나이가 들어갑니다.나이 때문이든 부상 때문이든 시간은 플레이어의 플레이 방식에 영향을 미칩니다.큰 부상을 입은 폭발성 포인트 가드는 회복 후 점프 슈팅에 더 의존하는 것처럼 보일 수 있으며 다른 플레이어가 공격을 실행하도록하는 동안 슈팅 가드로 더 적합합니다.
데이터 탐색
최종 모델을 만들기 위해 각 플레이어에 대해 51 개의 변수를 사용했습니다.분명히 각 통계를 생성하고 분석하는 데 엄청난 시간이 걸리므로이 블로그에는 몇 가지만 포함하겠습니다.더 많은 분석 및 시각화를 볼 수있는 내 Github 저장소에 대한 링크를 아래에 남겨 두겠습니다.
3 점 슈팅이 오늘날 NBA에서 점점 더 중요한 스킬이되었다고 간략히 말씀 드렸습니다.위치별로 4 시즌에 걸친 3 점 슈팅을 살펴 보겠습니다.

각 포지션은 지난 4 시즌 동안 100 포지션 당 3 개의 포인터를 증가 시켰으며, 파워 포워드와 센터의 비율이 시간이 지남에 따라 향상되었음을 알 수 있습니다.파워 포워드와 센터는 주변 위치와 같은 비율로 3 점을 얻지 못하지만 이는 플레이어의 재능 수준이 증가함에 따라
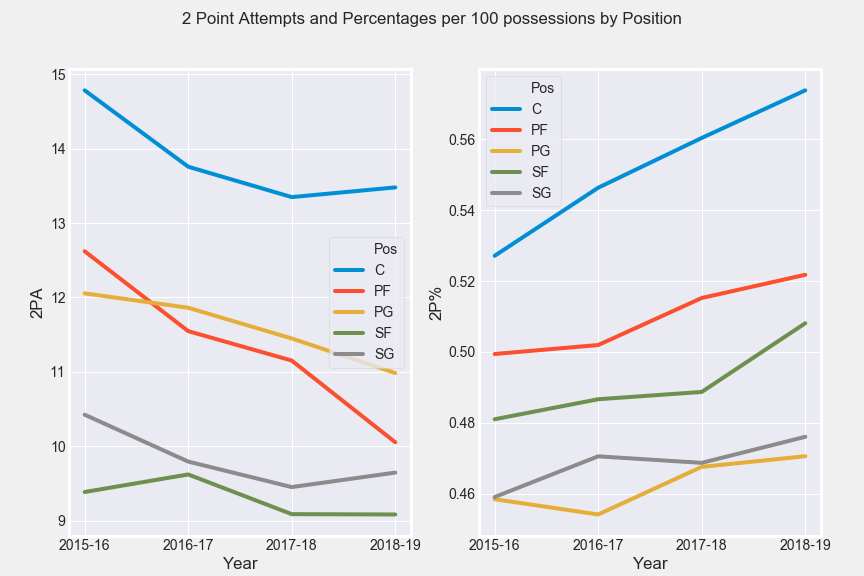
3 점 시도 횟수가 증가할수록 2 점 시도 횟수를 줄여야한다는 사실을 알 수 있습니다.모든 포지션에 걸쳐 전체적으로 긍정적 인 경향이 있습니다.전년 대비 2 포인트 퍼센트 증가는 미드 레인지 샷이 아닌 바스켓 근처에서 2 포인트 샷의 빈도가 높기 때문일 가능성이 높습니다.여기NBA에서 수년간 샷 선택이 어떻게 바뀌 었는지 알 수있는 좋은 기사입니다.
또한 소유 시간과 같은 플레이어 추적 메트릭을 살펴 보겠습니다.

여기서 주목할 점은 누가 가장 많이 공을 잡았는지에 대한 명확한 순서가있는 것 같다는 것입니다.통계를 통해 직위 간의 명확한 묘사가 분류 모델의 성능을 향상시키는 데 도움이 될뿐임을 알 수있었습니다.소유 시간과 유사하게, 100 개의 소유물 당 3 점 시도 횟수 또는 100 개의 소유물 당 2 점 비율을 보면 약간의 차이가 있습니다.
모델 선택
이 프로젝트에 사용한 최종 모델에 도달하기 전에 먼저 시도한 다른 모델 중 일부에 대해 논의하고 적합하지 않은 이유에 대해 논의하겠습니다.
로지스틱 회귀
적합하지 않은 이유 : 로지스틱 회귀 분석에서는 변수가 서로 독립적이어야합니다.
앞서 언급했듯이 각 플레이어의 위치를 결정하기 위해 51 개의 입력 변수가 있습니다.예를 들어, 전체 3 점 시도뿐만 아니라 캐치 앤슈 3 점 시도도 포함하도록 선택했습니다.캐치 앤슈 3 점 시도가 증가함에 따라 3 점 시도 횟수도 증가합니다.나는 그들의 위치를 예측하려고 할 때 3 개의 포인터를 잡아서 쏘는 숫자가 중요한 척도라고 주장 할 것이다.우리는 중앙에 비해 사격 경비원의 비율이 더 높을 것으로 예상 할 수 있습니다.
K 가까운 이웃
적합하지 않은 이유 : 정확도 점수는 기껏해야 평범했습니다.
3 개의 이웃으로 시작하여 모델 정확도는 64.5 %에 불과했습니다.더 많은 이웃으로 프로세스를 반복하면 정확도가 점진적으로 증가 할뿐입니다.11 개의 이웃은 68.8 %의 모델 정확도를 가져 왔습니다.정확성이 계속 향상되기를 바라면서 이웃 수를 계속 늘릴 수 있지만 위험 할 수 있습니다.
왜 위험한가요?두 명의 NBA 플레이어를 사용하여 K Nearest Neighbor 알고리즘이 작동하는 방식을 요약 해 보겠습니다.
게임당 어시스트 수와 게임당 리바운드로 플레이어를 분류하려고한다고 상상해보십시오.각 선수 (x 축은 어시스트, y 축은 리바운드)를 플로팅하면 어시스트 및 리바운드 수치가 높은 플레이어가 함께 클러스터링되고 어시스트 및 리바운드 수치가 낮은 플레이어가 함께 클러스터링됩니다.LeBron James는 평균 경기당 7.4 어시스트 (APG)와 경기당 7.4 리바운드 (RPG)를 기록했으며 Russell Westbrook은 경기당 평균 8.3 어시스트와 7.1 리바운드를 기록했으며 Jason Kidd는 평균 8.7APG와 6.3RPG를 기록했습니다.Russell Westbrook과 Jason Kidd는 포인트 가드이며 LeBron James (적어도 그의 커리어 대부분)는 스몰 포워드입니다.이 경우 가장 가까운 이웃 알고리즘은 LeBron을 포인트 가드로 분류하기 위해 선택합니다.분명히 우리는 LeBron이 포인트 가드 (또는 더 좋기는하지만 포인트 포워드)가되는 경우를 만들 수 있지만 이는 약간 다른 논의입니다.
랜덤 포레스트
적합하지 않은 이유 : 과적 합에 심각한 문제가 있습니다.
랜덤 포레스트와 XGBoost를 모두 사용하여 각각 78.2 %와 83.8 %의 훈련 정확도를 얻을 수있었습니다. 불행히도 테스트 세트의 모델 정확도는 각각 68.6 %와 69.5 %에 불과했습니다. 분명히 정확도의 차이로 인해 랜덤 포레스트 알고리즘이이 문제에 적합하지 않습니다. 랜덤 포레스트가 작동하는 방식을 생각할 때이 알고리즘이이 데이터에 대해 작동하지 않는 이유에 대한 직관을 개발할 수 있습니다. 본질적으로 랜덤 포레스트는 의사 결정 트리 그룹 일 뿐이며 각 의사 결정 트리는 데이터를 그룹으로 분할하는 임계 값을 설정합니다. 랜덤 포레스트의 의사 결정 트리 중 하나가 평균이 최소 5 PPG, 5 APG 및 5 RPG 인 모든 플레이어가 스몰 포워드 인 임계 값을 생성 한 경우 특히 해당 의사 결정 트리가 매우 자주 잘못 될 수 있음을 금방 알 수 있습니다. 이 평균을 충족하거나 초과 한 모든 포지션에 걸쳐 확실히 많은 플레이어가 있습니다. 위에서 설명한 것과 같은 의사 결정 트리가 보이지 않는 테스트 세트에 적용된 임의 포리스트가있는 경우 해당 임계 값이 적용되지 않을 수 있습니다.
그래서 어떤 모델이 작동 했습니까?
이 데이터에 대해 가장 성능이 좋은 모델은 서포트 벡터 머신이었습니다.교차 검증 된 훈련 정확도 74 %와 테스트 정확도 73 %를 얻을 수있었습니다.이 두 정확도 점수는 NBA 선수를 위치별로 분류 할 수있는 일반화 된 모델이 있다는 결론을 내릴 수있을만큼 충분히 가깝습니다.참고로 아래는이 모델에 대한 최적의 매개 변수입니다.GridSearchCV:
{ 'svc__C': 1,
'svc_gamma': '스케일',
'svc_kernel': '선형',
'svc_proability : True}
NBA에는 여러 직책을 맡을 수있을만큼 재능있는 선수가 많다는 것을 알고 있습니다.이것은 우리가 모델의 오 분류를 가지고 살 수 있음을 의미합니다.모델의 성능을 더 잘 이해하기 위해 몇 가지 숫자에 대해 논의하고 혼동 행렬을 살펴 보겠습니다.조다중 클래스 혼동 행렬을 해석하는 방법을 이해하기 위해).

위의 혼동 매트릭스를 살펴보면 파워 포워드의 24 %가 센터로, 스몰 포워드의 22 %가 슈팅 가드로, 슈팅 가드의 20 %가 스몰 포워드로 분류되었습니다.이러한 위치는 플레이어 (및 팀)에 따라 서로 바뀔 수 있다는 점을 고려할 때 특정 플레이어 분류가 허용되는지 여부를 이해하기 위해 특정 플레이어의 오 분류를 살펴볼 필요가 있습니다.
위의 최악의 오 분류는 스몰 포워드로 예측 된 센터 1 개와 파워 포워드로 예측 된 두 명의 슈팅 가드 일 가능성이 높습니다.또한 스몰 포워드로 잘못 분류 된 14 개의 파워 포워드 그룹을 볼 수도 있습니다.그 파워 포워드 중 일부가 스몰 포워드 포지션을 플레이하는 데 필요한 슈팅 능력과 볼 핸들링 스킬을 갖추었다면 오늘날 NBA에서 놀라운 일은 아닐 것입니다.
2016 NBA 결승에 대한 빠른 회상
플레이어의 위치 확률을 확인하기 위해 플레이어 메서드가 호출 된 클래스.position_breakdown () 이를 통해 모델이 각 플레이어를 어떻게 보는지 쉽게 시각화 할 수 있습니다.편리하게basketball-reference.com플레이어의 특정 위치에서 보낸 시간의 백분율을 추정하는 유사한 기능이 있습니다.이러한 추정치는 모델이 예측하는 위치 확률에 대한 벤치 마크를 제공 할 수 있습니다.
플레이어 개체를 인스턴스화하고 .position_breakdown () 앞에서 본 파이 플롯을 생성하려면 다음과 같이 메서드를 사용하십시오.
LeBron = Player('LeBron', 'James', '15-16')LeBron.position_breakdown()
소개에서 언급했듯이 위치 확률을 사용하여 다양한 라인업을 평가하고 해당 라인업이 상대방과 경쟁 할 때 어떤 장단점이 있는지 이해하기를 바랍니다.
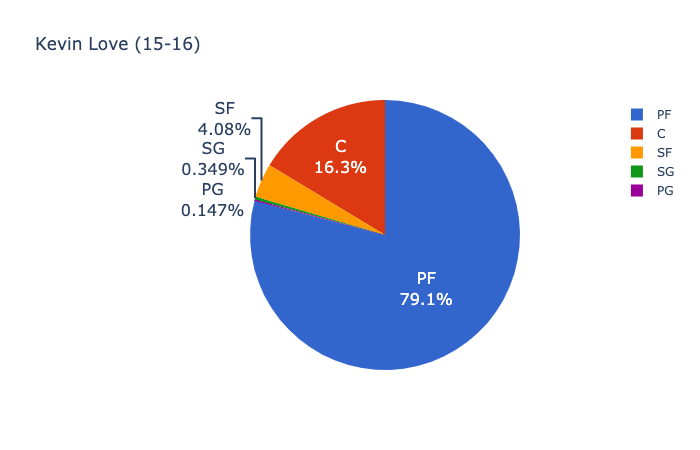
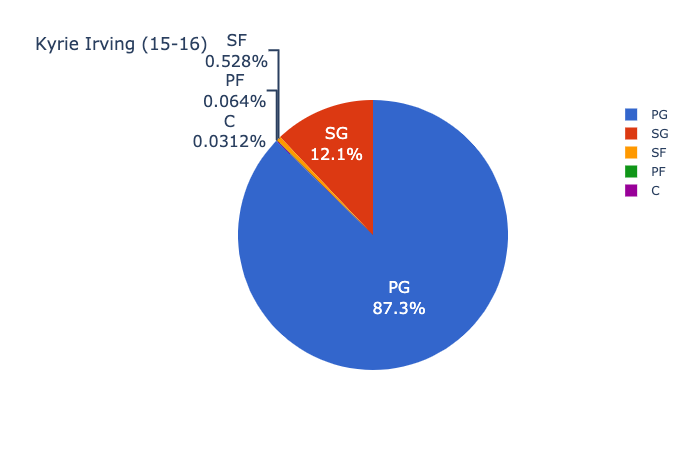
먼저 2015–2016 Cleveland Cavaliers :


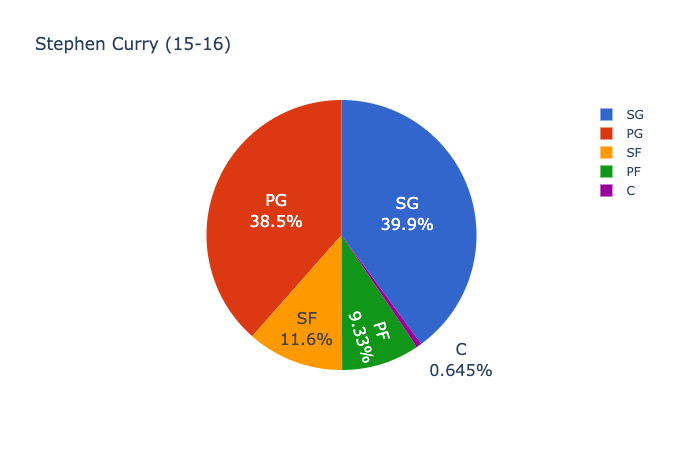
2015–2016 Golden State Warriors :


Andrew Bogut를 제외하고 2016 NBA 파이널의 선발 선수가 둘 이상의 포지션을 플레이 할 수 있다고 가정하는 것이 합리적입니다.게임 영화 및 스카우팅 보고서와 함께 사용할 때 클리블랜드 코칭 스태프는 이러한 위치 확률을 사용하여 공격시 Andrew Bogut를 더 작은 모바일 플레이어로 전환하고 그 불일치를 활용하도록 강요 할 수 있습니다.코칭 스태프는 트리스탄 톰슨의 윙 플레이어로 서브를 선택하고 케빈 러브가 센터로 이동하고 르브론이 파워 포워드로 이동하도록 할 수 있습니다.Kevin Love의 3 점슛 능력은 Bogut를 페인트에서 빼내고 Cavaliers가 LeBron이 바스켓에 더 명확한 차선을 가지고있는 플레이를 실행할 수 있도록합니다.
추가 모델 튜닝을 통해 플러스 / 마이너스 통계와 함께 이러한 위치 확률을 확인하여 다양한 라인업의 생산을 평가할 수 있습니다.
생각을위한 음식 : 해마다 변화하는 변화
여기 내가 관심이 있다고 생각했던 플레이어 포지션 분석이 더 있습니다!농구는 팀 게임이며 코트에서의 역할 / 위치는 코트에있는 다른 사람의 영향을받습니다.
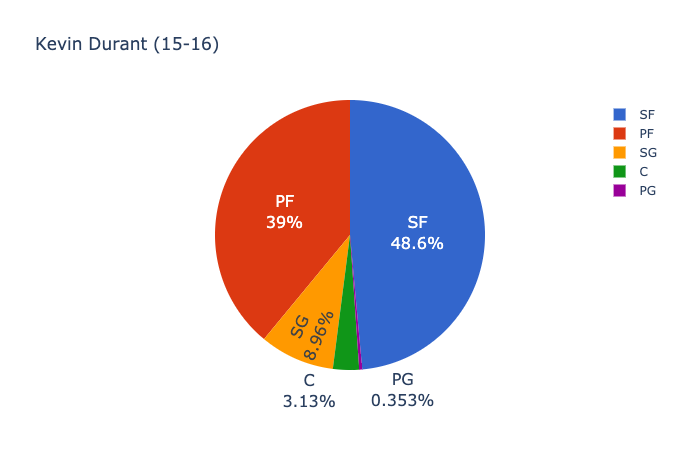
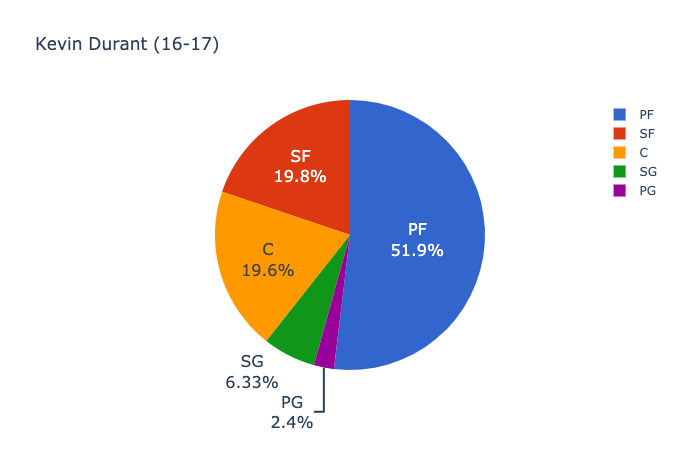
다음은 2015 ~ 16 년 오클라호마 시티 썬더의 Kevin Durant와 2016 ~ 17 년 Golden State Warriors의 Kevin Durant의 모습입니다.
같은 해에 Russell Westbrook의 위치 확률은 다음과 같습니다.


다음 단계 및 향후 고려 사항
이제 위치 확률을 예측할 수있는 기준 모델이 있으므로 확실히 개선하고 싶을 것입니다!모델을 개선 할 수있는 한 가지 가능한 방법은 주성분 분석을 사용하여 예측에 필요한 기능의 수를 줄이고 줄이는 것입니다.위에서 설명한 지원 벡터 머신은 51 개의 서로 다른 변수를 사용했으며 중요하지 않은 변수를 제거함으로써 모델 정확도를 향상시킬 수 있습니다.비 기술적 이해 관계자 (예 : 코치, 스카우트 또는 프론트 오피스)에게 모델 성능과 다양한 통계의 중요성을 설명 할 때 변수가 적을수록 더 도움이됩니다.
미래의 NBA 포지션 분류자는 대학 초안 유망주 나 서명되지 않은 FA를 평가하는 데에도 유용 할 수 있습니다.특정 대학 선수는 대학 팀에 비해 NBA 팀의 다른 위치에 더 잘 맞을 수 있습니다.안타깝게도 다른 국가의 대학이나 농구 리그에서는 선수 추적 데이터를 쉽게 사용할 수 없습니다.WNBA와 여자 대학 농구를 위해 동일한 모델을 만드는 것도 도움이 될 것이라고 생각하지만플레이어 추적 시스템의 채택이 뒤쳐지고 있습니다.여자 농구에서.
NBA 포지션 분류기를 구축하는 것도 또 다른 중요한 질문을 제기합니다.73 % 정확도의 모델을 사용하는 경우 기존의 5 가지 위치가 다양한 플레이 스타일을 설명하는 데 여전히 충분합니까?5 개 위치 중 3 개 위치에서 해당 플레이어 중 25 % 이상이 잘못 분류 된 것을 확인했습니다.나는 그 선수들 중 일부가 전혀 잘못 분류되지 않았고 오히려 5 개의 전통적인 위치 중 하나에 맞지 않는 다재다능한 기술을 가지고 있다고 주장합니다.콤보 가드, 3 & amp; D, 스트레치 4 또는 포인트 포워드와 같은 용어를 들어 보셨을 것입니다.이것은 새로운 용어가 아니며 이러한 유형의 선수들이 NBA 농구의 초기 시대로 거슬러 올라간다는 증거가 있지만 NBA 어휘에서는 더 자주 사용되는 용어가되었습니다.다행히 NBA 명단에서 선수의 다양한 역할을 더 잘 설명하기위한 연구와 분석이 이미 있습니다.(위의 내용이 흥미 롭다면이 기사를 반드시 읽으십시오).
여기까지왔다면 읽어 주셔서 감사합니다!조금 길었지만 농구 팬과 데이터 과학자 모두에게 통찰력있는 블로그를 작성하고 싶었습니다.언제나 그렇듯이 모든 피드백을 환영합니다.내 프로젝트 전체를 내Github.
Players, Positions, and Probability in the NBA
Players, Positions, and Probability in the NBA
Using Supervised Machine Learning to build an NBA Position Classifier
Let’s start this blog with an important question: Why would you need to use machine learning to classify NBA players by position? A casual basketball fan would likely have watched enough basketball to identify which player plays which position. Even a person with no knowledge of the game could find some YouTube clips of the all time greats to understand what each position does. So what extra information might a machine learning algorithm offer us that would justify its use?
Well, when it comes to the task of classification, machine learning algorithms are using a predicted probability to decide whether or not something belongs to a group. In the case of an NBA positions, a machine learning algorithm is going to predict the probability that the player is either a point guard, shooting guard, small forward, power forward, or center. The algorithm will give us a probability for each position for any given player. It’s these probabilities that could prove to be useful to a front office or discussion among NBA analysts. With each new generation of NBA talent, we have seen more hybridization amongst players when it comes to their skill set. Centers are no longer strictly close-to-the-basket low post players that only come to the 3 point line to set a screen. Modern centers drift out to the three point line to take and make 3’s, and some have the requisite skills to effectively run a fast break. With positional probabilities assigned to a player we can begin to understand the versatility of a player. If we know the positional probabilities of each player on a team, that can be used for a lineup analysis of your own team or the opponent.
Let’s also consider another use for these positional probabilities. Each year a panel of sportswriters and broadcasters vote for various awards like Most Valuable Player, Defensive Player of the Year, and the All-NBA teams. Per an article on hoopsrumors.com, players are eligible for a supermax contract (30% of a team’s salary cap) if they meet the following criteria:
- Make an All-NBA team in the previous season or in 2 of the 3 previous seasons
- Be named Defensive Player of the year in the previous season or in 2 of the 3 previous seasons
- Be named Most Valuable Player in at least one of the three previous seasons
Given that these media members’ vote can affect the future earnings of players it is paramount that we have metrics that are equitable when evaluating and comparing players. The inputs to an NBA position classifier algorithm would be some group of recorded statistics that describe a player’s performance and impact on a game. The algorithm would then take those inputs, perform some kind of math and provide us with the position probabilities. Assuming we make the right assumptions with our input and appropriately train the model, we can generate something like this:
If deciding between two potential MVP candidates, an award voter might use a tool like the one shown above and decide to go with the player who had greater positional diversity.
Data Collection
To create a model that can produce probabilities shown above we first have to collect data for each of the players. Per 100 possession stats and advanced stats were collected from basketball-reference.com. Player tracking data was collected from stats.nba.com via the nba_stats_tracking library for Python. The documentation for this library can be found here. Only player data from the 2015–16 through the 2018–19 season was used. I chose not to use the 2019–20 player data due to the abrupt suspension caused by COVID-19 and the inconsistent total number of regular season games played. Player tracking data from the NBA website is only available going back to the 2013–2014 season. As we’ll soon see, the NBA has gone through a bit of an evolution when it comes to shot selection. There has been a significant increase in the number of 3 pointers attempted and made across all teams in the NBA. By using 4 seasons of data that distinctly fall within the 3 point era, my goal was to prevent the model from making incorrect assumptions about a player due to statistical differences from year to year. Only regular season data was used. The different sources were combined into a single Pandas dataframe using the name of the player and the season. Each player was treated as a single observation (i.e. 2015–16 LeBron James is different from 2017–18 LeBron James). I chose to treat each player as a single observation for three reasons:
- To ensure that there was enough data for training and testing the model
- Rosters are very rarely the same from year to year. The introduction of a new player whether it be from the draft, a trade, or free agency may cause a coach to have to adjust lineups and the players themselves may alter their play for the betterment of team success.
- Just like everyone else, NBA players get older every year. Whether it be due to age or an injury, time does affect how players play. An explosive point guard who suffered a major injury might look to rely more on jump shooting after recovering and be better suited as shooting guard while letting another player run the offense.
Data Exploration
In order to build my final model, I ended up using 51 variables for each player. Obviously it would take an incredible amount of time to produce and analyze each of those statistics so I’ll only include a few in this blog. I’ll leave a link to my Github repo below where can you see more analysis and visualizations.
I briefly mentioned that 3 point shooting has become an increasingly important skill in today’s NBA. Let’s look at 3 point shooting across 4 seasons by position:
Each position has taken an increasing number of 3 pointers per 100 possessions over the past 4 seasons and we can also see that power forwards and centers have improved their percentage over time. Although power forwards and centers don’t make 3’s at the same rate as the perimeter positions, this is one metric that demonstrates that the increasingly level of talent from players requires that
We see that as the number of 3 point attempts increases, it holds true that the number of 2 point attempts must decrease. There has been an overall positive trend across all positions for percentage made. The year over year increase in 2 point percentage is likely attributed to a higher frequency of 2 point shots taken near the basket as opposed to a mid-range shot. Here is good article to see how shot selection has changed over the years in the NBA.
Let’s also take a look a player tracking metric such as time of possession.
What’s important to note here is that there seems to be a clear pecking order for who holds the ball the most. Statistics were we can see a clear delineation between positions is only going to help our classification model perform better. Similar to time of possession, we see some distinction when looking at the number of 3 point attempts per 100 possessions or 2 point percentage per 100 possessions.
Model Selection
Before we get to final model I used for this project, I’ll first discuss some of the other models that I tried and discuss the reasons why they were not a good fit.
Logistic Regression
Why it’s not a good fit: Logistic Regression requires the variables to be independent of each other.
As previously mentioned, I had 51 input variables for each player to determine their position. For example, I chose to include catch-and-shoot 3 point attempts as well as overall 3 point attempts. As catch-and-shoot 3 point attempts increases, so will the number of 3 point attempts. I would make the argument that number catch-and-shoot 3 pointers is an important metric when attempting to predict their position. We might expect a greater percentage of shooting guards to take catch-and-shoot 3’s compared to centers.
K Nearest Neighbors
Why it’s not a good fit: Accuracy scores were mediocre at best.
Starting with 3 neighbors, the model accuracy was only 64.5%. Repeating the process with more neighbors only led to an incremental increase in accuracy. 11 neighbors resulted in a model accuracy of 68.8%. Although we could continue to increase the number of neighbors in hopes that accuracy keeps improving, that might prove to be risky.
Why is it risky? Let’s recap how the K Nearest Neighbor algorithm works using two NBA players
Imagine we are trying to classify players just by the number of assists per game and rebounds per game. If we were to plot each player (assists on the x-axis and rebounds on the y-axis), players with high assist and rebound numbers would be clustered together and players with low assist and rebound numbers would be clustered together. LeBron James has averaged 7.4 assists per game (APG) and 7.4 rebounds per game (RPG) for his career, Russell Westbrook has averaged 8.3 assists and 7.1 rebounds per game, and Jason Kidd has averaged 8.7 APG and 6.3 RPG. Russell Westbrook and Jason Kidd are point guards, while LeBron James (at least for the majority of his career) is a small forward. The nearest neighbor algorithm would choose in this case to classify LeBron as a point guard. Obviously, we can make the case for LeBron being a point guard (or better yet a point forward) but that is a slightly different discussion.
Random Forests
Why it’s not a good fit: Serious problems with overfitting.
Using both random forests and XGBoost, I was able to get a training accuracy of 78.2% and 83.8% respectively. Unfortunately, model accuracy on the test set was only 68.6% and 69.5% respectively. Obviously, the difference in accuracy makes the random forest algorithm not feasible for this problem. When we think about how random forests work, we can develop some intuition as to why this algorithm might not work for this data. Essentially the random forest is just a group of decision trees, and each of those decision trees is establishing a threshold to split our data into groups. If one of the decision trees in the random forest created some threshold where all players with averages of at least 5 PPG, 5 APG, and 5 RPG were small forwards, we would quickly see that that decision tree in particular would be wrong very often. There are definitely a number of players across all positions who have met or exceeded those averages. If we have a random forest with decision trees like the one described above applied to an unseen test set, those thresholds might not be applicable.
So what model did work?
The best performing model for this data was a support vector machine. I was able to get a cross-validated training accuracy of 74% and a testing accuracy of 73%. Those two accuracy scores are close enough that we could conclude that we have a generalized model that can classify NBA players by position. For reference, below are the optimal parameters for this model found using GridSearchCV :
{'svc__C': 1,
 'svc_gamma': 'scale',
 'svc_kernel': 'linear',
 'svc_proability: True}
We know that there are many players in the NBA who are talented enough to play multiple positions. This means that we may able to live with some misclassifications from the model. To better understand how the model performed, let’s discuss some numbers and look at a confusion matrix (read this article to understand how to interpret a multi-class confusion matrix).
Looking at the confusion matrix above, 24% of power forwards were classified as centers, 22% of small forwards were classified as shooting guards, and 20% of shooting guards were classified as small forwards. Considering that those positions may be interchangeable depending on the player (and team), we would need to look at specific player misclassifications to understand whether or not those would be acceptable.
The worst misclassifications above are likely the one center who was predicted to be a small forward and the two shooting guards predicted to be power forwards. We might also look at the group of 14 power forwards that were misclassified as small forwards. It would not be a surprise in today’s NBA if some of those power forwards were to have the requisite shooting ability and ball handling skills to play the small forward position.
A Quick Flashback to the 2016 NBA Finals
In order to see the positional probabilities for a player I created a Player class with a method called .position_breakdown() that allows us to easily visualize how the model sees each player. Conveniently, basketball-reference.com has a similar feature which estimates the percentage of minutes spent at a certain position for a player. These estimates can provide a benchmark for the positional probabilities the model predicts.
We would instantiate a player object and call the .position_breakdown() method as follows to produce the pie plot seen earlier:
LeBron = Player('LeBron', 'James', '15-16')LeBron.position_breakdown()
As I mentioned in the introduction, we can use the positional probabilities to evaluate different lineups and hopefully gain an understanding as to what advantages or disadvantages those lineups have when pitted against their opponents.
First up, the 2015–2016 Cleveland Cavaliers:
2015–2016 Golden State Warriors:
With the exception of Andrew Bogut, it’s reasonable to assume that the starting players from the 2016 NBA Finals are capable of playing more than one position. When paired with game film and scouting reports, the Cleveland coaching staff might use these positional probabilities to take advantage of Andrew Bogut on offense by possibly forcing him to switch onto a smaller more mobile player and taking advantage of that mismatch. The coaching staff might also elect to sub in a wing player for Tristan Thompson and have Kevin Love shift to center and LeBron shift to power forward. Kevin Love’s ability to shoot from 3 might pull Bogut out of the paint and allow the Cavaliers to execute plays where LeBron has a clearer lane to the basket.
With further model tuning we might also look at these positional probabilities alongside a plus/minus statistic so that we could evaluate the production of different lineups.
Food for Thought: Year over Year Changes
Here are some more player position breakdowns that I thought were of interest! Basketball is a team game and your role/position on the court is going to be influenced by who else is on the court with you.
Here’s what it looks like for Kevin Durant with the Oklahoma City Thunder in 2015–16 versus Kevin Durant with the Golden State Warriors in 2016–17:
And here’s what the positional probabilities look like for Russell Westbrook in the same years:
Next Steps and Future Considerations
Now that we have a baseline model that can predict positional probabilities we would certainly want to improve it! One possible way to improve the model would be to use Principal Component Analysis to try and reduce the number of features required to make a prediction. The support vector machine described above used 51 different variables and by eliminating those variables that are insignificant we might be able to improve model accuracy. Fewer variables would also be more helpful when explaining model performance and the significance of various statistics to the non-technical stakeholders (e.g. coaches, scouts, or the front office).
A future NBA position classifier might also be useful in evaluating college draft prospects or unsigned free agents. Certain college players may be better fits at different positions with an NBA team as compared to their college team. Unfortunately, player tracking data isn’t as readily available for college or basketball leagues in other countries. I think it would also be beneficial to create these same models for the WNBA and women’s college basketball, but the adoption of player tracking systems is lagging behind in women’s basketball.
Building an NBA position classifier also raises another important question. With a model that is 73% accurate, are the traditional 5 positions still sufficient in describing the various styles of play? We saw that across three of the 5 positions, at least 25% of those players were misclassified. I’d argue that some of those players weren’t misclassified at all, but rather that have a versatile enough skillset that they don’t fit into one of the five traditional positions. You may have heard of terms like a combo guard, 3&D, stretch 4, or point forward. While these aren’t new terms and there is evidence of these types of players going back to earlier eras of NBA basketball, they have become more frequent used terms in the NBA lexicon. Fortunately there is already research and analysis that has been done in terms of trying to better describe the different roles of players on an NBA roster (definitely read this article if any of the above has been interesting to you).
If you made it this far, thanks so much for reading! It was a bit long, but I wanted to write a blog that would be insightful for basketball fans and data scientists alike. As always, any and all feedback is welcome. You can find my project in its entirety at my Github.
Feel free to reach out on LinkedIn or Twitter if you want to discuss more about data science or basketball analytics!