
2021년 2월 9일 모바일 게임 매출 순위
| Rank | Game | Publisher |
|---|---|---|
| 1 | 리니지M | NCSOFT |
| 2 | 리니지2M | NCSOFT |
| 3 | 그랑사가 | NPIXEL |
| 4 | 기적의 검 | 4399 KOREA |
| 5 | Cookie Run: Kingdom | Devsisters Corporation |
| 6 | 세븐나이츠2 | Netmarble |
| 7 | Genshin Impact | miHoYo Limited |
| 8 | R2M | Webzen Inc. |
| 9 | 바람의나라: 연 | NEXON Company |
| 10 | V4 | NEXON Company |
| 11 | Pmang Poker : Casino Royal | NEOWIZ corp |
| 12 | 메이플스토리M | NEXON Company |
| 13 | 라이즈 오브 킹덤즈 | LilithGames |
| 14 | 리니지2 레볼루션 | Netmarble |
| 15 | 블레이드&소울 레볼루션 | Netmarble |
| 16 | 뮤 아크엔젤 | Webzen Inc. |
| 17 | FIFA ONLINE 4 M by EA SPORTS™ | NEXON Company |
| 18 | A3: 스틸얼라이브 | Netmarble |
| 19 | 미르4 | Wemade Co., Ltd |
| 20 | S.O.S:스테이트 오브 서바이벌 | KingsGroup Holdings |
| 21 | Brawl Stars | Supercell |
| 22 | 찐삼국 | ICEBIRD GAMES |
| 23 | 한게임 포커 | NHN BIGFOOT |
| 24 | 카운터사이드 | NEXON Company |
| 25 | Roblox | Roblox Corporation |
| 26 | PUBG MOBILE | KRAFTON, Inc. |
| 27 | 검은강호2: 이터널 소울 | 9SplayDeveloper |
| 28 | 한게임포커 클래식 with PC | NHN Corp. |
| 29 | AFK 아레나 | LilithGames |
| 30 | 어비스(ABYSS) | StairGames Inc. |
| 31 | KartRider Rush+ | NEXON Company |
| 32 | Dungeon Knight: 3D Idle RPG | mobirix |
| 33 | Lords Mobile: Kingdom Wars | IGG.COM |
| 34 | 블리치: 만해의 길 | DAMO NETWORK LIMITED |
| 35 | 그랑삼국 | YOUZU(SINGAPORE)PTE.LTD. |
| 36 | Age of Z Origins | Camel Games Limited |
| 37 | 라그나로크 오리진 | GRAVITY Co., Ltd. |
| 38 | Gardenscapes | Playrix |
| 39 | 리니지M(12) | NCSOFT |
| 40 | Homescapes | Playrix |
| 41 | 뮤오리진2 | Webzen Inc. |
| 42 | FIFA Mobile | NEXON Company |
| 43 | Cookie Run: OvenBreak – Endless Running Platformer | Devsisters Corporation |
| 44 | 사신키우기 온라인 : 팝캣 (Pop Cat)을 획득하라! | DAERISOFT |
| 45 | 갑부: 장사의 시대 | BLANCOZONE NETWORK KOREA |
| 46 | 검은사막 모바일 | PEARL ABYSS |
| 47 | Empires & Puzzles: Epic Match 3 | Small Giant Games |
| 48 | Top War: Battle Game | Topwar Studio |
| 49 | 명일방주 | Yostar Limited. |
| 50 | 슬램덩크 | DeNA HONG KONG LIMITED |
3 Must-have JupyterLab 2.0 extensions -번역
3 필수 JupyterLab 2.0 확장
JupyterLab은 코드 지원, 디버깅 및 Git과 같은 기능을 갖춘 완전한 IDE가되었습니다. 노트북 편집의 미래에 오신 것을 환영합니다.

JupyterLab이 최신 확장 기능의 도움으로 본격적인 IDE가되었음을 확인하게되어 기쁩니다.일주일 전에 JupyterLab으로 노트북을 편집하는 동안 발견 한 몇 가지 결함에 대해 언급했습니다. 존재하지 않는 코드 지원도 그중 하나였습니다.
JupyterLab-LSP의 수석 개발자 중 한 명이 저에게 연락하여 확장 기능을 보여주었습니다.시도해 보았습니다. Jupyter 생태계의 엄청난 개선입니다.
아직 몇 JupyterLab 생태계의 누락 된 부분을 최소한 기능 측면에서 PyCharm과 동일하게 만듭니다.하지만 더 이상은 아닙니다.
다음은 관심을 가질만한 몇 가지 링크입니다.
- Labeling and Data Engineering for Conversational AI and Analytics- Data Science for Business Leaders [Course]- Intro to Machine Learning with PyTorch [Course]- Become a Growth Product Manager [Course]- Deep Learning (Adaptive Computation and ML series) [Ebook]- Free skill tests for Data Scientists & Machine Learning Engineers
위의 링크 중 일부는 제휴 링크이며 구매를 위해 통과하면 수수료를 받게됩니다.내가 코스를 링크하는 이유는 구매에 대한 수수료 때문이 아니라 품질 때문이라는 점을 명심하십시오.
이 주제와 관련된 이전 기사를 놓친 경우 :
JupyterLab-LSP
JupyterLab-LSP는 JupyterLab에 코드 지원 기능을 추가합니다.읽다JupyterLab 2.0.그것에 대해 자세히 알아 보려면 :
디버거
저는 pdb 패키지를 사용하여 JupyterLab에서 디버깅을 수행했습니다. 매우 힘든 과정이었습니다.며칠 전 새로운 디버깅 확장 프로그램에 대해 들었고이 기능을 사용해보고 싶었습니다.
적절한 디버거는 JupyterLab 생태계에서 마지막으로 누락 된 부분 중 하나입니다.최신 JupyterLab 확장의 개발자에게 모든 찬사를 보냅니다. 설치는 첫 번째 시도, 잘 작성된 문서 등에서 작동합니다. 디버거 확장과 다르지 않았습니다.디버거는 JupyterLab 2.0 이상 만 지원하며 아직 개발 중입니다.
How to enable the debugger?
디버거는 xpython Notebook에서 작동합니다. x는 xeus의 약자이며 Jupyter 용 커널 구현을 용이하게하기위한 라이브러리입니다.개발자가 커널의 인터프리터 부분을 구현하는 데 집중할 수 있도록 Jupyter Kernel 프로토콜을 구현하는 부담이 필요합니다.
디버거를 사용하는 방법?
함수의 변수 값을 조사하여 디버거를 시도했습니다. 이것은 pdb 패키지를 사용할 때 가장 큰 고통이었습니다. 그리고 잘 작동합니다.또한 클래스와 DataFrame의 값을 조사하려고했습니다.모든 것이 완벽하게 작동합니다.
그것을 설치하는 방법?
JupyterLab 2.0 이상이 설치되어 있고 Extension Manager가 활성화되어 있는지 확인하십시오.그런 다음 요구 사항을 설치하십시오.
pip install xeus-python == 0.7.1
pip 설치 ptvsd
확장을 설치하려면 다음을 실행하십시오.
jupyter labextension 설치@ jupyterlab / 디버거
JupyterLab-Git
Jupyter Notebook을 Git에 푸시 한 다음 일부를 변경하고 다시 푸시 한 적이 있다면 Git의 diff 기능이 쓸모가 없다는 것을 알 수 있습니다. 모든 것을 표시합니다.푸시하기 전에 모든 출력을 재설정하여 해결 방법을 사용했지만 가끔 잊어 버리고 (또는 JupyterLab이 최신 상태를 저장하지 않음) 결국 큰 문제가 발생했습니다.나는 이것에 대해 정말 흥분됩니다.내 기대에 부응할까요?
해 보자
와, 정말 놀랐습니다.노트북에서 몇 가지를 변경했는데 diff 기능이 정말 잘 작동합니다.에 대한 명성jupyterlab-git팀.
팁 : 노트북에서 변경 사항을 되돌릴 때는 먼저 노트북을 닫은 다음 되돌리기를 사용하십시오.더 잘 작동합니다.
커밋 내역
커밋 내역을 관찰 할 수 있습니다. 이것은 킬러 기능입니다.이미지도 보여줍니다.마침내 노트북 전체를 통하지 않고도 동료가 변경 한 내용을 관찰 할 수 있습니다.
그것을 설치하는 방법?
JupyterLab 2.0 이상이 설치되어 있고 Extension Manager가 활성화되어 있는지 확인하십시오.그런 다음 다음을 실행하십시오.
pip 설치-jupyterlab-git 업그레이드
Jupyter Lab 빌드
설치 후 Extension Manager는 패키지가 오래된 것으로 표시되었으므로 업데이트를 클릭하고 잠시 기다린 후 다시 빌드를 확인하고 jupyter-lab을 다시 시작했습니다.그런 다음 작동했습니다!
결론
JupyterLab에 대한 이전 기사에서 언급했듯이 노트북 편집의 미래는 밝습니다 ☀️ vim 확장 및 코드 포맷터 확장을 사용할 수있게되면 JupyterLab 2.x로 전환 할 것입니다.그때까지는 JupyterLab 1.2를 고수하겠습니다.
가기 전에
나를 따라와트위터, 내가 정기적으로트위터데이터 과학 및 기계 학습에 대해.
3 Must-have JupyterLab 2.0 extensions
3 Must-have JupyterLab 2.0 extensions
JupyterLab just became a full-fledged IDE with features like Code Assistance, Debugging and Git — welcome to the future of Notebook editing.
I am happy to confirm that JupyterLab just became a full-fledged IDE with the help of the latest extensions. A week ago, I mentioned a couple of deficiencies that I notice while editing Notebooks with JupyterLab — nonexistent code assistance was one of them.
Soon after one of the lead developers of JupyterLab-LSP contacted me and showed me their extension. I gave it a try — it is a massive improvement in the Jupyter ecosystem.
There were still a couple of missing pieces in the JupyterLab ecosystem to make it at least equivalent to PyCharm in terms of features. But not anymore.
Here are a few links that might interest you:
- Labeling and Data Engineering for Conversational AI and Analytics- Data Science for Business Leaders [Course]- Intro to Machine Learning with PyTorch [Course]- Become a Growth Product Manager [Course]- Deep Learning (Adaptive Computation and ML series) [Ebook]- Free skill tests for Data Scientists & Machine Learning Engineers
Some of the links above are affiliate links and if you go through them to make a purchase I’ll earn a commission. Keep in mind that I link courses because of their quality and not because of the commission I receive from your purchases.
In case you’ve missed my previous articles related to this topic:
JupyterLab-LSP
JupyterLab-LSP adds code assistance capabilities to JupyterLab. Read JupyterLab 2.0. to learn more about it:
Debugger
I used to do debugging in JupyterLab with pdb package — it was a painful process. A few days ago, I heard about a new debugging extension and I was really intrigued to give it a try:
A proper debugger is one of the last missing pieces in the JupyterLab ecosystem. All praise to the developers of the latest JupyterLab extensions — install works on a first try, well-written documentation, etc. It was no different with the debugger extension. Note, that debugger supports only JupyterLab ≥ 2.0 and it is still under active development.
How to enable the debugger?
The debugger works in xpython Notebook — x is short for xeus, which is a library meant to facilitate the implementation of kernels for Jupyter. It takes the burden of implementing the Jupyter Kernel protocol so developers can focus on implementing the interpreter part of the kernel.
How to use the debugger?
I tried the debugger by investigating the values of variables in a function — this was the biggest pain point when using pdb package — and it works well. I also tried to investigate the values of a class and a DataFrame. It all works flawlessly.
How to install it?
Make sure you have JupyterLab ≥ 2.0 installed and Extension Manager enabled. Then install requirements:
pip install xeus-python==0.7.1
pip install ptvsd
To install the extension, run:
jupyter labextension install @jupyterlab/debugger
JupyterLab-Git
If you’ve ever pushed a Jupyter Notebook to Git, then made some changes to it and pushed it again, you know that Git’s diff functionality is useless — it marks everything. I used a workaround by resetting all outputs before pushing it, but sometimes I forgot (or JupyterLab didn’t save the latest state) and there was a big mess in the end. I am really excited about this one. Will it meet my expectations?
Let’s try it
Wow, I was really amazed by this one. I made a few changes in the Notebook and the diff functionality really works well. Kudos to the jupyterlab-git team.
Tip: When reverting changes in a Notebook , first close the Notebook, then use revert. It works better
Commit history
You can observe commit history — this is a killer feature. It even shows images. You can finally observe what a coworker had changed without going through the whole Notebook.
How to install it?
Make sure you have JupyterLab ≥ 2.0 installed and Extension Manager enabled. Then run:
pip install --upgrade jupyterlab-git
jupyter lab build
After installing it, Extension Manager showed that packages are outdated so I’ve clicked update, waited some time, confirmed the rebuild and restarted the jupyter-lab. Then it worked!
Conclusion
Like I’ve mentioned in my previous articles about JupyterLab — the future of Notebook editing is bright ☀️ I’m going to switch over to JupyterLab 2.x when vim extension and code formatter extensions become available. Until then I going to stick will JupyterLab 1.2.
Before you go
Follow me on Twitter, where I regularly tweet about Data Science and Machine Learning.
2021년 2월 8일 모바일 게임 매출 순위
| Rank | Game | Publisher |
|---|---|---|
| 1 | 리니지M | NCSOFT |
| 2 | 리니지2M | NCSOFT |
| 3 | 그랑사가 | NPIXEL |
| 4 | 기적의 검 | 4399 KOREA |
| 5 | Cookie Run: Kingdom | Devsisters Corporation |
| 6 | 세븐나이츠2 | Netmarble |
| 7 | Genshin Impact | miHoYo Limited |
| 8 | R2M | Webzen Inc. |
| 9 | 바람의나라: 연 | NEXON Company |
| 10 | V4 | NEXON Company |
| 11 | Pmang Poker : Casino Royal | NEOWIZ corp |
| 12 | 메이플스토리M | NEXON Company |
| 13 | 라이즈 오브 킹덤즈 | LilithGames |
| 14 | 리니지2 레볼루션 | Netmarble |
| 15 | 블레이드&소울 레볼루션 | Netmarble |
| 16 | 뮤 아크엔젤 | Webzen Inc. |
| 17 | FIFA ONLINE 4 M by EA SPORTS™ | NEXON Company |
| 18 | A3: 스틸얼라이브 | Netmarble |
| 19 | 미르4 | Wemade Co., Ltd |
| 20 | S.O.S:스테이트 오브 서바이벌 | KingsGroup Holdings |
| 21 | Brawl Stars | Supercell |
| 22 | 찐삼국 | ICEBIRD GAMES |
| 23 | 한게임 포커 | NHN BIGFOOT |
| 24 | 카운터사이드 | NEXON Company |
| 25 | Roblox | Roblox Corporation |
| 26 | PUBG MOBILE | KRAFTON, Inc. |
| 27 | 검은강호2: 이터널 소울 | 9SplayDeveloper |
| 28 | 한게임포커 클래식 with PC | NHN Corp. |
| 29 | AFK 아레나 | LilithGames |
| 30 | 어비스(ABYSS) | StairGames Inc. |
| 31 | KartRider Rush+ | NEXON Company |
| 32 | Dungeon Knight: 3D Idle RPG | mobirix |
| 33 | Lords Mobile: Kingdom Wars | IGG.COM |
| 34 | 블리치: 만해의 길 | DAMO NETWORK LIMITED |
| 35 | 그랑삼국 | YOUZU(SINGAPORE)PTE.LTD. |
| 36 | Age of Z Origins | Camel Games Limited |
| 37 | Summoners War | Com2uS |
| 38 | 라그나로크 오리진 | GRAVITY Co., Ltd. |
| 39 | Gardenscapes | Playrix |
| 40 | 리니지M(12) | NCSOFT |
| 41 | 뮤오리진2 | Webzen Inc. |
| 42 | Homescapes | Playrix |
| 43 | FIFA Mobile | NEXON Company |
| 44 | Cookie Run: OvenBreak – Endless Running Platformer | Devsisters Corporation |
| 45 | Top War: Battle Game | Topwar Studio |
| 46 | 사신키우기 온라인 : 팝캣 (Pop Cat)을 획득하라! | DAERISOFT |
| 47 | Clash of Clans | Supercell |
| 48 | 갑부: 장사의 시대 | BLANCOZONE NETWORK KOREA |
| 49 | 검은사막 모바일 | PEARL ABYSS |
| 50 | Empires & Puzzles: Epic Match 3 | Small Giant Games |
Stylize and Automate Your Excel Files with Python -번역
Python + Excel
Python으로 Excel 파일 스타일 화 및 자동화
초보자가 Python을 시작하는 방법 인 xlwings를 사용하여 양식화 된 Excel 보고서를 만드는 데 Python을 활용하는 방법.
Introduction
세계로의 여정을 처음 시작할 때 통과 할 기본 게이트웨이는 없습니다.피이썬.언어의 일반적인 사용 범위는 데이터 과학에서 기계 학습, 인공 지능에 이르기까지 다양합니다.이들은 Python을 빠르게 구현할 수있는 훌륭한 영역이지만 대부분의 회사에서 대다수의 인력을위한 사용 사례가 없습니다.금융 서비스는 다른 산업과 함께 여전히 기본적인 데이터 조작을 위해 Excel을 사용하고 있습니다.이런 방식으로 작업하는 사람은 Python이 이러한 복잡한 주제와 수년에 걸쳐 구축 한 연관성을 고려할 때 Python을 잠재적 인 솔루션으로 고려하지 않을 수 있습니다.
Python에 대한 노출은 수동 Microsoft Excel 작업에 투자하는 시간을 최소화해야하기 때문입니다.반복적 인 작업을 자동화하면 엄청난 양의 작업자 시간을 확보 할 수 있으므로 당면한 더 복잡한 문제에 집중할 수 있습니다.VBA는이 워크 플로의 속도를 높이는 데 이상적인 솔루션처럼 보였습니다.
VBA를 배우고 이해하기까지 몇 달이 걸렸습니다.그러나 그 역량의 지점에 도달하더라도이 접근 방식이 얼마나 효율적이고 효과적인지 엄격하게 정의하고 제한하는 융통성없는 한계가있는 것처럼 느껴졌습니다.그때 제가 파이썬에 관심을 돌렸고 파이썬이 제가 필요하다는 것이 분명해지기까지 오래 걸리지 않았습니다.
매일 Excel을 사용하고 이러한 작업의 자동화를 검토 중이며 현재 VBA를 배우려고하는 상황에 처해있는 경우이 문서에서 작업 과정을 변경할 수 있습니다.
VBA 대신 Python을 사용하는 Excel을 사용하는 이유
Python은 표준 라이브러리에 내장 된 강력한 패키지의 방대한 배열을 포함합니다.또한 설치하기 쉬운 타사 모듈을 활용할 수 있습니다.이들의 조합은 VBA에 비해 코드를 실행하는 데 걸리는 시간뿐 아니라 필요한 코드의 양을 크게 줄일 수 있습니다.이를 보여주는 가장 좋은 방법은 간단한 예입니다.
VBA와 Python 및 Pandas를 사용하여 데이터 세트의 열에서 각 고유 값을 계산하는 방법을 쉽게 비교할 수 있습니다.다음 두 가지 방법 모두 초보자가이를 달성 할 수있는 방법입니다.
VBA
이 코드는 Excel의= COUNTIF ()함수를 사용하고 결과를 새 통합 문서에 붙여 넣습니다.
하위 매크로 ()Workbooks ( "Book1"). 활성화
Workbooks ( "Book1"). Sheets ( "fruit_and_veg_sales"). Activate
열 ( "B : B"). 선택
선택. 복사
통합 문서. 추가
ActiveSheet.Paste
Application.CutCopyMode = False
ActiveSheet.Range ( "$ A : $ A"). RemoveDuplicates 열 : = 1, 헤더 : = xlNoRange ( "B1") = "개수"
Range ( "B2"). Formula = "= COUNTIF ([Book1] fruit_and_veg_sales! $ B : $ B, A2)"
범위 ( "B2"). 복사
Range ( "B2 : B"& amp; ActiveSheet.UsedRange.Rows.Count) .PasteSpecial xlPasteAll
계산하다
Range ( "B2 : B"& amp; ActiveSheet.UsedRange.Rows.Count) .Copy
Range ( "B2 : B"& amp; ActiveSheet.UsedRange.Rows.Count) .PasteSpecial xlPasteValues
Application.CutCopyMode = False

End Sub
Python
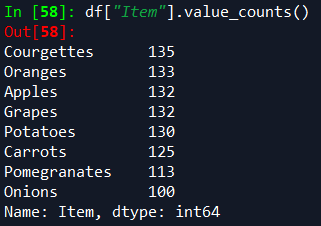
df [ "col"]. value_counts ()Pandas를 사용하는 Python에서 필요한 모든 것입니다.(또한 추가 혜택으로 값을 정렬합니다)
Python에서 이미 사용 가능한 패키지를 사용하고 최종 데이터를 Excel로 출력하면 데이터의 모든 일반 사용자에 대해 동일한 출력을 유지하면서 전체 자동화 프로세스의 속도를 높일 수 있습니다.여기서 절약되는 시간은 코드를 적게 작성하는 것뿐만 아니라 훨씬 더 이해하기 쉬운 코드를 작성하는 것입니다.
이렇게하면 귀하와 향후 코드 사용자 모두에게 엄청난 시간을 절약 할 수 있습니다.
이제 알 수있을 것입니다. Python은 초보자가 쉽게 익힐 수있는 언어입니다.아직 뛰어 들지 않으려는 사람들에게는 Excel과 통합 할 수 있고 익숙한 인터페이스를 사용하는 것이 Python을 쉽게 사용할 수있는 완벽한 방법입니다.
Python과 Excel로 첫 걸음을 내 디딘 후 SQL 데이터베이스에서 언어를 사용하고 웹 사이트에서 데이터를 스크랩하고 대시 보드를 만드는 데 더 큰 진전을 이룰 것입니다.Python 모듈로 모든 것을 쉽게 달성 할 수 있습니다.
Python을 시작하는 것은 이러한 추가 기술을 배우는 데 큰 도움이 될 수 있습니다!
xlwings
이제이 보고서 작성을 어떻게 시작합니까?
큐 xlwings…
xlwings는 Python 코드를 사용하여 Excel을 쉽게 조작하고 자동화 할 수있는 오픈 소스 Python 라이브러리입니다.xlwings는 Python의 과학 패키지 (NumPy, Pandas, SciPy, scikit-learn 등)를 활용하고 VBA 대신 Python으로 도구를 작성하며 Python에서 Excel에서 사용할 사용자 정의 함수를 만들 수 있습니다.대시 보드를 만들어 Excel 데이터에 온라인으로 액세스 할 수도 있습니다!요약하면 xlwings는 현재 Excel 툴킷과 워크 플로를 크게 향상시킬 수있는 기능을 가지고 있습니다!
선호하는 Python 설치 방법이 Anaconda 인 경우 2020 년 11 월 릴리스부터 xlwings 0.20.8이 Anaconda의 사전 설치된 패키지에 내장됩니다.즉, Anaconda를 통해 Python을 설치하면 xlwings를 자동으로 가져 와서 사용할 수 있습니다.
이 사전 설치가없는 경우pip 설치 xlwings거기로 데려다 줄 것입니다.
xlwings는 Excel 기반 작업의 자동화와 보고서 작성에 매우 유용했습니다.Python을 사용하고 Excel과 상호 작용할 수있게되면서 Excel을 뒷좌석 역할로 밀어 붙이면서 더 복잡한 코딩 주제를 배우는 데 시간을 집중할 수있었습니다.
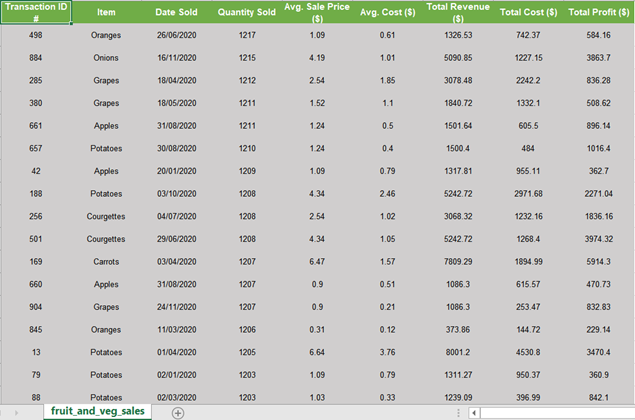
데이터를 표현 가능한 보고서로 포맷
이 튜토리얼에 사용하기 위해 csv 형식의 과일 및 채소 판매 테스트 데이터 세트를 만들었습니다.
데이터는 Github에서 다운로드 할 수 있습니다.링크
Steps to creating your report!
- Import Pandas and xlwings. We will be focusing on xlwings in this tutorial. Pandas will only be used to quickly import our data into Python.
import pandas as pd
Import xlwings as xw
2. 이제 Pandas를 사용하여 csv 파일을 DataFrame으로 가져옵니다.
df = pd.read_csv (r”path_to_csv / fruit_and_veg_sales.csv”)
팁:대신이 줄을 실행하여 Github에서 직접 csv 파일을 읽을 수도 있습니다.df = pd.read_csv (r "https://raw.githubusercontent.com/Nishan-Pradhan/xlwings_report/master/fruit_and_veg_sales.csv")
이제 Python에 데이터가 있으므로 조작이나 추가 계산을 자유롭게 수행 할 수 있습니다.이 튜토리얼의 목적을 위해 데이터를 그대로 유지합니다.
3. Excel 통합 문서를 초기화합니다.
wb = xw.Book ()
여기서 우리는 통합 문서의 이름을wb사용 된 xlwings도서()Excel 통합 문서를 초기화합니다.
4. 다음으로 워크 시트 참조를 변수로 설정하고 시트의 이름을 변경합니다.
sht = wb.sheets [ "Sheet1"]
sht.name = "fruit_and_veg_sales"
여기에서 Excel Sheet1에 대한 참조를 다음과 같이 설정합니다.쉿Sheet1의 이름을 fruit_and_veg_sales로 변경했습니다.
5. 이제 과일 및 채소 판매와 함께 Python으로 된 DataFrame이 있고 “fruit_and_veg_sales”라는 시트가있는 열린 Excel 통합 문서가 있습니다.다음 단계는 Python에서 Excel로 데이터를 가져 오는 것입니다.다음을 호출하여이를 수행합니다.
sht.range ( "A1"). options (index = False) .value = df
VBA를 알고 있다면 익숙한 구문을 인식해야합니다.sht.range ( "A1").여기에서 DataFrame을 얻으려면dfExcel 문서에 데이터를 저장할 위치를 지정했습니다 (이 경우 “A1″셀).
그만큼.options (index = False)원치 않는 색인 복사를 방지합니다.DataFrame의 인덱스가 필요한 경우 줄의이 부분을 제거 할 수 있습니다.진실기본적으로, 즉sht.range ( "A1"). value = df.
포함하는 것을 잊지 마십시오.값, 이것을 지정하지 않으면 구문 오류가 발생합니다.SyntaxError : cal에 함수를 할당 할 수 없습니다...값곧 다룰 다른 속성이 아니라 Excel 셀의 값에 대해 이야기하고 있음을 xlwings에 알립니다.
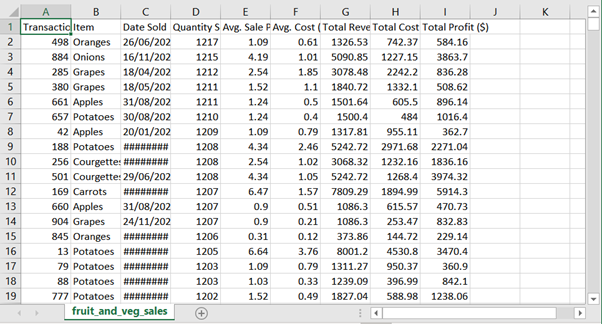
6. 이제 완전히 서식이 지정되지 않은 데이터가있는 Excel 파일을보고 있어야합니다.
7. Python에서 Excel로 데이터를 가져 왔습니다.이제 포맷을 시작하겠습니다!
Excel 내에서 데이터 서식을 지정할 때 가장 먼저해야 할 일은 서식을 지정할 데이터를 선택하는 것입니다.xlwings에서이를 수행하기 위해 시트의 범위와 관련된 변수를 생성합니다.
all_data_range = sht.range ( "A1"). expand ( 'table')
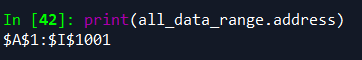
여기 사용sht.range ( "A1"). expand ( 'table')기본적으로 A1 셀에서 시작하여 CTRL + SHIFT + ↓ (아래쪽 화살표), CTRL + SHIFT + → (오른쪽 화살표)로 이동하여 데이터 (Windows)를 선택합니다.그러면 범위 A1 : I1001이 선택되고이 범위 참조는 이름이 지정된 변수에 저장됩니다.모든 _ 데이터 _ 범위.
Python에서 변수로 참조하는 범위를 확인하려면print (모든 _ 데이터 _ 범위. 주소).
8. 범위 참조 변수를 설정 했으므로 이제 보고서 스타일 지정을 시작할 수 있습니다.데이터의 행과 열 높이부터 시작하겠습니다.
all_data_range.row_height = 22.5
all_data_range.column_width = 12
22.5 및 12는 Microsoft 설명서에 따라 ‘기본 글꼴의 문자’에있는 Excel의 크기 측정을 나타냅니다.
9. 다음으로 셀의 배경색을 변경합니다.이를 위해 튜플에서 RGB 색상을 사용합니다.
all_data_range.color = (208,206,206)
이렇게하면 범위의 배경색이 밝은 회색으로 변경됩니다.
10. 텍스트를 편집하려면 필요한 기능이 약간 다릅니다.xlwings를 사용하여 Microsoft의 Excel API를 호출합니다.이것은 VBA를 사용하는 것과 거의 동일합니다.
all_data_range.api.Font.Name = 'Arial'
all_data_range.api.Font.Size = 8all_data_range.api.HorizontalAlignment = xw.constants.HAlign.xlHAlignCenterall_data_range.api.VerticalAlignment = xw.constants.HAlign.xlHAlignCenterall_data_range.api.WrapText = True
여기에서는 데이터의 글꼴을 Arial로 변경하고 글꼴 크기를 8로 설정하고 텍스트 중앙을 가로 및 세로로 정렬하고 마지막으로 텍스트 줄 바꿈을 켜서 셀의 모든 텍스트를 봅니다.
11. 테이블을 더욱 매력적으로 보이게하기 위해 몇 가지 색상을 추가하고 헤더 형식을 지정합니다.
header_range = sht.range ( "A1"). expand ( 'right')
header_range.color = (112,173,71)
header_range.api.Font.Color = 0xFFFFFF
header_range.api.Font.Bold = True
header_range.api.Font.Size = 9
이 블록은 이전에했던 것처럼 범위를 선택합니다.이 선택의 주요 차이점은.expand ( 'right')CTRL + SHIFT + → (오른쪽 화살표)로만 전환됩니다.이를 통해 A1 셀에서 시작하여 Excel의 헤더 열인 I1을 선택할 수 있습니다.
여기서 또 다른 차이점은 글꼴 색상을 흰색으로 변경하도록 선택했다는 것입니다.이를 위해 16 진수 코드를 사용하여 색상을 지정했습니다.0xFFFFFF.
12. 이제 거래 ID 번호 열의 형식을 지정하겠습니다.나는 이것을 더 밝은 녹색 음영으로 만들고 싶습니다.앞서 언급 한 RGB 방법을 사용하여이를 수행 할 수 있습니다.이번에는확장 ( '아래')셀 A2에서.
id_column_range = sht.range ( "A2"). expand ( 'down')
id_column_range.color = (198,224,180)
13. 다음 단계에서는 데이터의 테두리 색상 만 변경합니다 (헤더 열 또는 트랜잭션 ID # 열 제외).Microsoft의 API는 경계 작업에 약간 어색하지만 문서화여기충분합니다.
요약, 위쪽, 아래쪽, 왼쪽 및 오른쪽 테두리는 각각 숫자 7,8,9,10으로 지정됩니다.
data_ex_headers_range = sht.range ( "A2"). expand ( 'table')범위 (7,13)의 border_id :
data_ex_headers_range.api.Borders (border_id) .Weight = 2
data_ex_headers_range.api.Borders (border_id) .Color = 0xFFFFFF
14. 마지막 단계는 보고서를 저장하는 것입니다.요구wb.save (), 저장하려는 경로와 원하는 파일 이름을 지정하십시오.파일 이름을 파일 형식으로 끝내는 것을 잊지 마십시오.이 경우 우리는.xlsx모든 형식을 유지합니다.
wb.save (r "폴더로 _ 경로 \ fruit_and_veg_report.xlsx")
Bonus!
추가로 탭 색상을 녹색으로 변경합니다.
sht.api.Tab.Color = 0x70AD47
Conclusion
몇 줄의 간단한 코드로 최종 사용자를 위해 깔끔하고 표현 가능한 형식으로 Excel 문서를 만들 수있었습니다.이 튜토리얼은 창의력을 발휘하고 자신 만의 미학적으로 만족스러운 보고서를 만들 수있는 충분한 xlwings 구성 요소를 제공해야합니다!빈 행을 삽입하고 글꼴 크기, 배경색, 테두리 두께 및 테두리 색상을 변경하여 보고서를 더욱 멋지게 만드십시오!
이것은 Python과 xlwings를 사용하여 달성 할 수있는 것의 시작일뿐입니다!
Stylize and Automate Your Excel Files with Python
Python + Excel
Stylize and Automate Your Excel Files with Python
How to utilize Python to create a stylized Excel report using xlwings, a way for beginners to get started with Python.
Introduction
There is no default gateway to walk through when you first embark on your journey into the realm of Python. Typical uses of the language range from Data Science to Machine Learning to Artificial Intelligence, amongst many other buzzwords. While these are great areas where Python can be implemented quickly, they do not have a use case for a vast majority of the workforce in most companies. Financial Services, along with other industries, still use and heavily rely on Excel for basic data manipulation. Anyone working in this way might be dissuaded from considering Python as a potential solution given the association it has built up over the years with these complex topics.
My exposure to Python stemmed from a need to minimise the time I was investing in manual Microsoft Excel work. Automation of repetitive tasks can free up an extraordinary amount of worker hours, allowing you to focus on the more complex issues at hand. VBA seemed like the ideal solution to speed up this workflow.
It took a few months before I learnt and got to grips with VBA. But even reaching that point of competency, it still felt as if there was an inflexible ceiling strictly defining and constraining how efficient and effective this approach could be. That was when I turned my attention towards Python and it didn’t take long before it was obvious that Python was what I needed.
If you find yourself in the situation where you use Excel daily, are looking into automation of these tasks and are now trying to learn VBA, this article may change your course of action.
Why Excel with Python instead of VBA?
Python contains a vast array of powerful packages built into the standard libraries. Additionally, you can take advantage of easy-to-install third party modules. The combination of these can drastically reduce the amount of code needed as well as the time taken to execute the code in comparison to VBA. A quick example would be the best way of demonstrating this.
You can easily compare how to count each unique value in a column of a dataset using VBA vs Python and Pandas. Both of the following methods are how a beginner might achieve these.
VBA
This code takes advantage of Excel’s =COUNTIF() function and pastes the results to a new workbook.
Sub Macro()Workbooks("Book1").Activate
    Workbooks("Book1").Sheets("fruit_and_veg_sales").Activate
    Columns("B:B").Select
    Selection.Copy
    Workbooks.Add
    ActiveSheet.Paste
    Application.CutCopyMode = False
    ActiveSheet.Range("$A:$A").RemoveDuplicates Columns:=1,  Header:=xlNoRange("B1") = "Count"
    Range("B2").Formula = "=COUNTIF([Book1]fruit_and_veg_sales!$B:$B,A2)"
    Range("B2").Copy
    Range("B2:B" & ActiveSheet.UsedRange.Rows.Count).PasteSpecial xlPasteAll
    Calculate
    Range("B2:B" & ActiveSheet.UsedRange.Rows.Count).Copy
    Range("B2:B" & ActiveSheet.UsedRange.Rows.Count).PasteSpecial xlPasteValues
    Application.CutCopyMode = False

End Sub
Python
df["col"].value_counts() is all you require in Python using Pandas. (It also sorts the values as an added benefit)
Making use of packages already available in Python and outputting the final data to Excel could speed up the entire automation process whilst keeping the output identical for all regular users of the data. The time saved here is not only by writing less lines of code, but also writing code that is far more comprehensible.
This can save an immense amount of time for both you and future users of your code.
You may be able to see now, Python is a far easier language for beginners to pick up. For those of you who are still more reticent to take the plunge, being able to integrate with Excel, to use an interface you are familiar with, is a perfect way to ease yourself into Python.
After taking your first baby steps with Python and Excel, it won’t be long before you’re taking larger strides towards using the language with SQL databases, scraping data from websites and creating dashboards. All can be easily achieved with Python modules.
Getting started with Python can be a great segue into learning these additional skills!
xlwings
Now, how do we get started on creating this report?
Cue xlwings…
xlwings is an open-source Python library which allows easy manipulation and automation of Excel using Python code. xlwings is able to leverage Python’s scientific packages (NumPy, Pandas, SciPy, scikit-learn ,etc.), write tools with Python instead of VBA, and create User Defined Functions in Python to use in Excel. You can even create dashboards to access your Excel data online! In summary, xlwings has the capability to significantly boost your current Excel toolkit and workflow!
If your preferred method of Python installation is Anaconda then, as of the November 2020 release, xlwings 0.20.8 is built into Anaconda’s pre-installed packages. This means if you install Python through Anaconda you will automatically be able to import and use xlwings.
If you do not have this pre-installed pip install xlwings will get you there.
xlwings has been exceptionally useful for me in the automation of Excel-based work and creation of reports. Being able to use Python and interact with Excel has enabled me to focus my time on learning more complex coding topics while pushing Excel into more of a backseat role.
Formatting data into a presentable report
I have created a test dataset of fruit and veg sales in csv format to use for this tutorial.
Data can be downloaded from Github: link
Steps to creating your report!
- Import Pandas and xlwings. We will be focusing on xlwings in this tutorial. Pandas will only be used to quickly import our data into Python.
import pandas as pd
Import xlwings as xw
2. We now import the csv file as a DataFrame using Pandas.
df = pd.read_csv(r”path_to_csv/fruit_and_veg_sales.csv”)
Tip: you can also read the csv file directly from Github by running this line instead df = pd.read_csv(r"https://raw.githubusercontent.com/Nishan-Pradhan/xlwings_report/master/fruit_and_veg_sales.csv")
Now that we have the data in Python, you are free to do any manipulation or further calculations. For the purpose of this tutorial we will keep the data as it is.
3. Initialize the Excel Workbook.
wb = xw.Book()
Here we have named our workbook wb and used xlwings Book() to initialize our Excel Workbook.
4. Next, we’ll set our Worksheet reference as a variable and change the name of the sheet.
sht = wb.sheets["Sheet1"]
sht.name = "fruit_and_veg_sales"
here we set our reference to our Excel Sheet1 as shtand renamed our Sheet1 to fruit_and_veg_sales.
5.We now have our DataFrame in Python with our fruit and vegetable sales and have an open Excel Workbook with a sheet named “fruit_and_veg_sales”. The next step is to get our data out from Python and into Excel. We do this by calling:
sht.range("A1").options(index=False).value = df
If you know VBA, you should recognise the familiar syntax of sht.range("A1"). Here, to get our DataFrame df into our Excel document we specified where to place the data (cell “A1”, in this case).
The .options(index=False) avoids copying over the unwanted index. If you require the index of your DataFrame, you can remove this part of the line as this is True by default, i.e. sht.range("A1").value = df.
Don’t forget to include .value , without specifying this you will get a Syntax Error which will look something along the lines of SyntaxError: can't assign a function to a cal. .value tells xlwings that you are talking about the value in your Excel cell rather than any other attributes which we will touch upon shortly.
6. You should now be looking at an Excel file with completely unformatted data in front of you.
7. We have taken the data from Python to Excel. Now we will start on the formatting!
When formatting data within Excel, the first thing you do is select which data you want to format. To do this in xlwings we will create a variable relating to a range in our sheet.
all_data_range = sht.range("A1").expand('table')
Here using sht.range("A1").expand('table') we basically are starting at cell A1 and going then CTRL + SHIFT + ↓ (Down Arrow) then CTRL + SHIFT + → (Right Arrow) to select our data (Windows). This will select the range A1:I1001 and this range reference is saved to our variable named all_data_range.
To check which range you are referencing with your variable in Python run print(all_data_range.address).
8. With our range reference variable set up, we can now start stylising our report. We will start with the row and column height for our data.
all_data_range.row_height = 22.5
all_data_range.column_width = 12
22.5 and 12 refer to Excel’s measure of size which is in ‘characters of default font’ according to the Microsoft documentation.
9. Next, we’ll change the background colour of the cells. For this we will be using RGB colours in a tuple.
all_data_range.color = (208,206,206)
This will change the background colour of our range to a light grey.
10. To edit our text, the functions needed are slightly different. We will be using xlwings to call into Microsoft’s Excel api. This will be almost identical to using VBA.
all_data_range.api.Font.Name = 'Arial'
all_data_range.api.Font.Size = 8all_data_range.api.HorizontalAlignment = xw.constants.HAlign.xlHAlignCenterall_data_range.api.VerticalAlignment = xw.constants.HAlign.xlHAlignCenterall_data_range.api.WrapText = True
Here we are changing the font of our data to Arial, setting the font size to 8, making our text centre aligned both horizontally and vertically, and finally, turning on Wrap Text to see all the text in our cells.
11. To make our table look more appealing we’ll add some colours and format our headers.
header_range = sht.range("A1").expand('right')
header_range.color = (112,173,71)
header_range.api.Font.Color = 0xFFFFFF
header_range.api.Font.Bold = True
header_range.api.Font.Size = 9
This block selects a range as we did previously. The main difference with this selection is that we are using .expand('right') to only CTRL + SHFT + → (Right Arrow). This allows us to start at cell A1 and select to I1, which is only our header column in Excel.
Another difference here is that we have chosen to change the font colour to white. To do this we have specified the colour using a hex code 0xFFFFFF.
12. We’ll now format our Transaction ID number column. I want to shade this a lighter shade of green. We can do this using the RGB method previously mentioned. This time we will expand('down') from cell A2.
id_column_range = sht.range("A2").expand('down')
id_column_range.color=(198,224,180)
13. The next step will change the colour of the borders for only our data (not the header column or the Transaction ID# column). Microsoft’s api is slightly awkward for working with the borders but their documentation here is fairly sufficient.
Summarised, top, bottom, left and right borders are specified with the numbers 7,8,9,10 respectively.
data_ex_headers_range = sht.range("A2").expand('table')for border_id in range(7,13):
    data_ex_headers_range.api.Borders(border_id).Weight = 2
    data_ex_headers_range.api.Borders(border_id).Color = 0xFFFFFF
14. The final step will be saving our report. Call wb.save(), specify the path you wish to save to and the desired filename. Remember to end your filename with a filetype. In this case we are going for .xlsx to keep all of our formatting.
wb.save(r"path_to_folder\fruit_and_veg_report.xlsx")
Bonus!
As an added extra, we will also be changing the tab color to green.
sht.api.Tab.Color = 0x70AD47
Conclusion
In a few simple lines of code we have managed to create an Excel document with clean and presentable formatting for an end user. This tutorial should give enough xlwings building blocks for you to get creative and make your own aesthetically pleasing reports! Try inserting blank rows, changing font sizes, background colours, border weights and border colours to make your report look even better!
This is only the start of what you can achieve using Python and xlwings!