
Python + Excel
Stylize and Automate Your Excel Files with Python
How to utilize Python to create a stylized Excel report using xlwings, a way for beginners to get started with Python.
Introduction
There is no default gateway to walk through when you first embark on your journey into the realm of Python. Typical uses of the language range from Data Science to Machine Learning to Artificial Intelligence, amongst many other buzzwords. While these are great areas where Python can be implemented quickly, they do not have a use case for a vast majority of the workforce in most companies. Financial Services, along with other industries, still use and heavily rely on Excel for basic data manipulation. Anyone working in this way might be dissuaded from considering Python as a potential solution given the association it has built up over the years with these complex topics.
My exposure to Python stemmed from a need to minimise the time I was investing in manual Microsoft Excel work. Automation of repetitive tasks can free up an extraordinary amount of worker hours, allowing you to focus on the more complex issues at hand. VBA seemed like the ideal solution to speed up this workflow.
It took a few months before I learnt and got to grips with VBA. But even reaching that point of competency, it still felt as if there was an inflexible ceiling strictly defining and constraining how efficient and effective this approach could be. That was when I turned my attention towards Python and it didn’t take long before it was obvious that Python was what I needed.
If you find yourself in the situation where you use Excel daily, are looking into automation of these tasks and are now trying to learn VBA, this article may change your course of action.
Why Excel with Python instead of VBA?
Python contains a vast array of powerful packages built into the standard libraries. Additionally, you can take advantage of easy-to-install third party modules. The combination of these can drastically reduce the amount of code needed as well as the time taken to execute the code in comparison to VBA. A quick example would be the best way of demonstrating this.
You can easily compare how to count each unique value in a column of a dataset using VBA vs Python and Pandas. Both of the following methods are how a beginner might achieve these.
VBA
This code takes advantage of Excel’s =COUNTIF() function and pastes the results to a new workbook.
Sub Macro()Workbooks("Book1").Activate
    Workbooks("Book1").Sheets("fruit_and_veg_sales").Activate
    Columns("B:B").Select
    Selection.Copy
    Workbooks.Add
    ActiveSheet.Paste
    Application.CutCopyMode = False
    ActiveSheet.Range("$A:$A").RemoveDuplicates Columns:=1,  Header:=xlNoRange("B1") = "Count"
    Range("B2").Formula = "=COUNTIF([Book1]fruit_and_veg_sales!$B:$B,A2)"
    Range("B2").Copy
    Range("B2:B" & ActiveSheet.UsedRange.Rows.Count).PasteSpecial xlPasteAll
    Calculate
    Range("B2:B" & ActiveSheet.UsedRange.Rows.Count).Copy
    Range("B2:B" & ActiveSheet.UsedRange.Rows.Count).PasteSpecial xlPasteValues
    Application.CutCopyMode = False

End Sub
Python
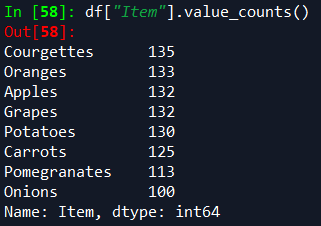
df["col"].value_counts() is all you require in Python using Pandas. (It also sorts the values as an added benefit)
Making use of packages already available in Python and outputting the final data to Excel could speed up the entire automation process whilst keeping the output identical for all regular users of the data. The time saved here is not only by writing less lines of code, but also writing code that is far more comprehensible.
This can save an immense amount of time for both you and future users of your code.
You may be able to see now, Python is a far easier language for beginners to pick up. For those of you who are still more reticent to take the plunge, being able to integrate with Excel, to use an interface you are familiar with, is a perfect way to ease yourself into Python.
After taking your first baby steps with Python and Excel, it won’t be long before you’re taking larger strides towards using the language with SQL databases, scraping data from websites and creating dashboards. All can be easily achieved with Python modules.
Getting started with Python can be a great segue into learning these additional skills!
xlwings
Now, how do we get started on creating this report?
Cue xlwings…
xlwings is an open-source Python library which allows easy manipulation and automation of Excel using Python code. xlwings is able to leverage Python’s scientific packages (NumPy, Pandas, SciPy, scikit-learn ,etc.), write tools with Python instead of VBA, and create User Defined Functions in Python to use in Excel. You can even create dashboards to access your Excel data online! In summary, xlwings has the capability to significantly boost your current Excel toolkit and workflow!
If your preferred method of Python installation is Anaconda then, as of the November 2020 release, xlwings 0.20.8 is built into Anaconda’s pre-installed packages. This means if you install Python through Anaconda you will automatically be able to import and use xlwings.
If you do not have this pre-installed pip install xlwings will get you there.
xlwings has been exceptionally useful for me in the automation of Excel-based work and creation of reports. Being able to use Python and interact with Excel has enabled me to focus my time on learning more complex coding topics while pushing Excel into more of a backseat role.
Formatting data into a presentable report
I have created a test dataset of fruit and veg sales in csv format to use for this tutorial.
Data can be downloaded from Github: link
Steps to creating your report!
- Import Pandas and xlwings. We will be focusing on xlwings in this tutorial. Pandas will only be used to quickly import our data into Python.
import pandas as pd
Import xlwings as xw
2. We now import the csv file as a DataFrame using Pandas.
df = pd.read_csv(r”path_to_csv/fruit_and_veg_sales.csv”)
Tip: you can also read the csv file directly from Github by running this line instead df = pd.read_csv(r"https://raw.githubusercontent.com/Nishan-Pradhan/xlwings_report/master/fruit_and_veg_sales.csv")
Now that we have the data in Python, you are free to do any manipulation or further calculations. For the purpose of this tutorial we will keep the data as it is.
3. Initialize the Excel Workbook.
wb = xw.Book()
Here we have named our workbook wb and used xlwings Book() to initialize our Excel Workbook.
4. Next, we’ll set our Worksheet reference as a variable and change the name of the sheet.
sht = wb.sheets["Sheet1"]
sht.name = "fruit_and_veg_sales"
here we set our reference to our Excel Sheet1 as shtand renamed our Sheet1 to fruit_and_veg_sales.
5.We now have our DataFrame in Python with our fruit and vegetable sales and have an open Excel Workbook with a sheet named “fruit_and_veg_sales”. The next step is to get our data out from Python and into Excel. We do this by calling:
sht.range("A1").options(index=False).value = df
If you know VBA, you should recognise the familiar syntax of sht.range("A1"). Here, to get our DataFrame df into our Excel document we specified where to place the data (cell “A1”, in this case).
The .options(index=False) avoids copying over the unwanted index. If you require the index of your DataFrame, you can remove this part of the line as this is True by default, i.e. sht.range("A1").value = df.
Don’t forget to include .value , without specifying this you will get a Syntax Error which will look something along the lines of SyntaxError: can't assign a function to a cal. .value tells xlwings that you are talking about the value in your Excel cell rather than any other attributes which we will touch upon shortly.
6. You should now be looking at an Excel file with completely unformatted data in front of you.
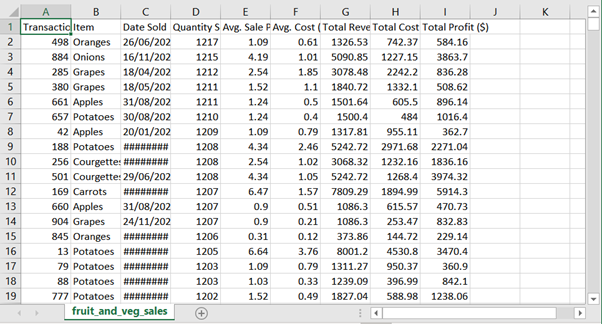
7. We have taken the data from Python to Excel. Now we will start on the formatting!
When formatting data within Excel, the first thing you do is select which data you want to format. To do this in xlwings we will create a variable relating to a range in our sheet.
all_data_range = sht.range("A1").expand('table')
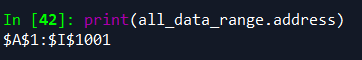
Here using sht.range("A1").expand('table') we basically are starting at cell A1 and going then CTRL + SHIFT + ↓ (Down Arrow) then CTRL + SHIFT + → (Right Arrow) to select our data (Windows). This will select the range A1:I1001 and this range reference is saved to our variable named all_data_range.
To check which range you are referencing with your variable in Python run print(all_data_range.address).
8. With our range reference variable set up, we can now start stylising our report. We will start with the row and column height for our data.
all_data_range.row_height = 22.5
all_data_range.column_width = 12
22.5 and 12 refer to Excel’s measure of size which is in ‘characters of default font’ according to the Microsoft documentation.
9. Next, we’ll change the background colour of the cells. For this we will be using RGB colours in a tuple.
all_data_range.color = (208,206,206)
This will change the background colour of our range to a light grey.
10. To edit our text, the functions needed are slightly different. We will be using xlwings to call into Microsoft’s Excel api. This will be almost identical to using VBA.
all_data_range.api.Font.Name = 'Arial'
all_data_range.api.Font.Size = 8all_data_range.api.HorizontalAlignment = xw.constants.HAlign.xlHAlignCenterall_data_range.api.VerticalAlignment = xw.constants.HAlign.xlHAlignCenterall_data_range.api.WrapText = True
Here we are changing the font of our data to Arial, setting the font size to 8, making our text centre aligned both horizontally and vertically, and finally, turning on Wrap Text to see all the text in our cells.
11. To make our table look more appealing we’ll add some colours and format our headers.
header_range = sht.range("A1").expand('right')
header_range.color = (112,173,71)
header_range.api.Font.Color = 0xFFFFFF
header_range.api.Font.Bold = True
header_range.api.Font.Size = 9
This block selects a range as we did previously. The main difference with this selection is that we are using .expand('right') to only CTRL + SHFT + → (Right Arrow). This allows us to start at cell A1 and select to I1, which is only our header column in Excel.
Another difference here is that we have chosen to change the font colour to white. To do this we have specified the colour using a hex code 0xFFFFFF.
12. We’ll now format our Transaction ID number column. I want to shade this a lighter shade of green. We can do this using the RGB method previously mentioned. This time we will expand('down') from cell A2.
id_column_range = sht.range("A2").expand('down')
id_column_range.color=(198,224,180)
13. The next step will change the colour of the borders for only our data (not the header column or the Transaction ID# column). Microsoft’s api is slightly awkward for working with the borders but their documentation here is fairly sufficient.
Summarised, top, bottom, left and right borders are specified with the numbers 7,8,9,10 respectively.
data_ex_headers_range = sht.range("A2").expand('table')for border_id in range(7,13):
    data_ex_headers_range.api.Borders(border_id).Weight = 2
    data_ex_headers_range.api.Borders(border_id).Color = 0xFFFFFF
14. The final step will be saving our report. Call wb.save(), specify the path you wish to save to and the desired filename. Remember to end your filename with a filetype. In this case we are going for .xlsx to keep all of our formatting.
wb.save(r"path_to_folder\fruit_and_veg_report.xlsx")
Bonus!
As an added extra, we will also be changing the tab color to green.
sht.api.Tab.Color = 0x70AD47
Conclusion
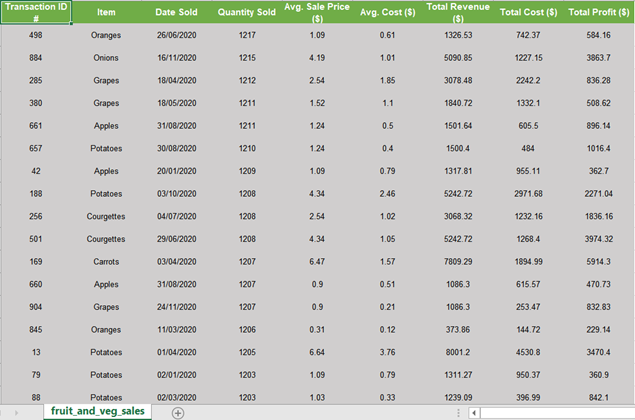
In a few simple lines of code we have managed to create an Excel document with clean and presentable formatting for an end user. This tutorial should give enough xlwings building blocks for you to get creative and make your own aesthetically pleasing reports! Try inserting blank rows, changing font sizes, background colours, border weights and border colours to make your report look even better!
This is only the start of what you can achieve using Python and xlwings!