
None
DataAnalytics(en)
How to efficiently re-partition Spark DataFrames
How to efficiently re-partition Spark DataFrames
How to increase or decrease the number of a Spark DataFrame
Apache Spark is a framework that enables the process of enormous amount of data in a reasonable amount of time. The efficiency of this unified engine is hugely dependent on its ability to distribute and parallelise the work performed over a collection of data.
In this article, we are going to introduce partitions in Spark and also explain how to re-partition DataFrames. Additionally, we will also discuss when it is worth increasing or decreasing the number of partitions of Spark DataFrames in order to optimise the execution time as much as possible.
Spark Partitioning in a nutshell
In order to achieve high parallelism, Spark will split the data into smaller chunks called partitions which are distributed across different nodes in the Spark Cluster. Every node, can have more than one executor each of which can execute a task.
The distribution of the work into multiple executors requires data to be partitioned and distributed across the executors, so that the work can be done in parallel in order to optimise the data processing for a specific job.
How to get current number of partitions
Before jumping into re-partitioning, it is worth describing the way one can use to get the current number of partitions of a Spark DataFrame. As an example, let’s assume that we have the following minimal Spark DataFrame
In order to get the number of partitions of the above dataframe, all we have to do is run the following
Note that the output is dependent to your current setup and configuration so you might see a different output.
How to increase the number of partitions
If you want to increase the partitions of your DataFrame, all you need to run is the repartition() function.
Returns a new
DataFramepartitioned by the given partitioning expressions. The resulting DataFrame is hash partitioned.
The code below will increase the number of partitions to 1000:
How to decrease the number of partitions
Now if you want to repartition your Spark DataFrame so that it has fewer partitions, you can still use repartition() however, there’s a more efficient way to do so.
coalesce() results in a narrow dependency, which means that when used for reducing the number of partitions, there will be no shuffle, which is probably one of the most costly operations in Spark.
Returns a new
DataFramethat has exactly N partitions.
In the example below we limit our partitions to 100. The Spark DataFrame that originally has 1000 partitions, will be repartitioned to 100 partitions without shuffling. By no shuffling we mean that each the 100 new partitions will be assigned to 10 existing partitions. Therefore, it is way more efficient to call coalesce() when one wants to reduce the number of partitions of a Spark DataFrame.
Conclusion
In this article we discussed how data processing is optimised through partitions that allow the work to be distributed across the executors of a Spark Cluster. Additionally, we also explored the two possible ways one can use in order to increase or decrease the number of partitions in DataFrames.
repartition() can be used for increasing or decreasing the number of partitions of a Spark DataFrame. However, repartition() involves shuffling which is a costly operation.
On the other hand, coalesce() can be used when we want to reduce the number of partitions as this is more efficient due to the fact that this method won’t trigger data shuffling across the nodes of the Spark Cluster.
My Favorite Mac Utilities
My Favorite Mac Utilities
Five simple utilities that make my Mac that much better.
I like to write about hardware a lot, like laptops, headphones, or even pens and notebooks. What I don’t talk about enough are applications or tools that I use on those pieces of hardware.
I have been using a Mac for almost ten years now, besides the times in-between where I used iPads full-time. Over that time, I have picked up on a few tools, utilities, and apps that I like to use regularly.
For this post, I would like to go over the utilities that I use. Ones that are immediately reinstalled on any new MacBook. Some of these might be considered applications, but I see them as tools that get me to where I want to go or something I setup that runs in the background without needing me.
I will continue with more posts to go over applications and other processes and tools that I use, but I wanted to start simple for now. So here are my favorite utilities that I constantly use on my Mac.
Bartender 4 ($15)
This utility has been around for ages. It was around way before I even got into using a Mac, my computer of choice. The utility is precisely what its name says; it is a “tender” of the menu “bar.”
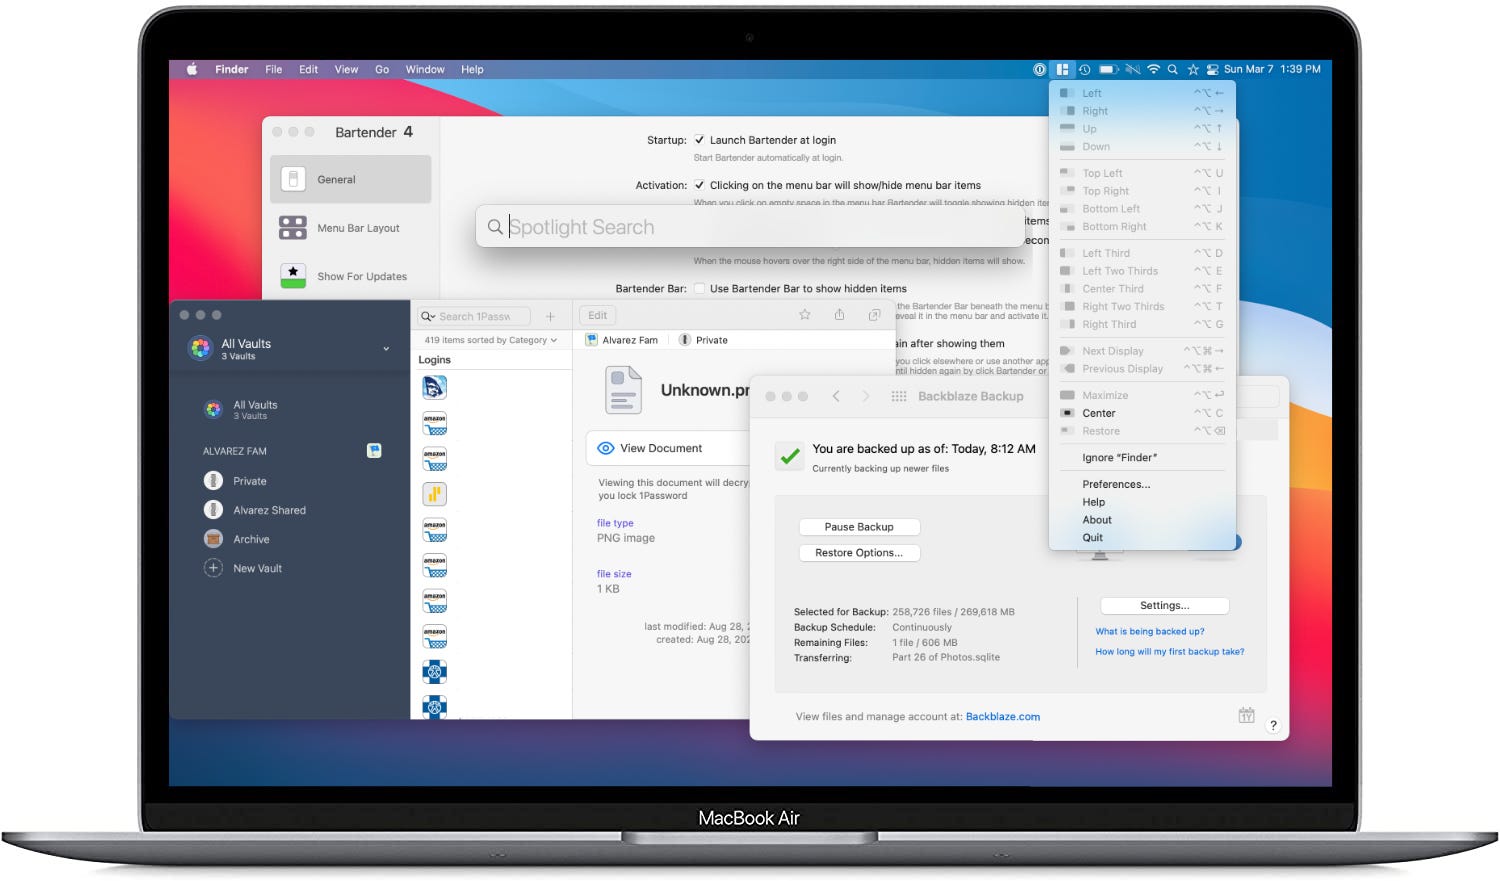
All of my menu bar icons for apps or other utilities on my Mac. What once looked like this:

Now it looks like this:

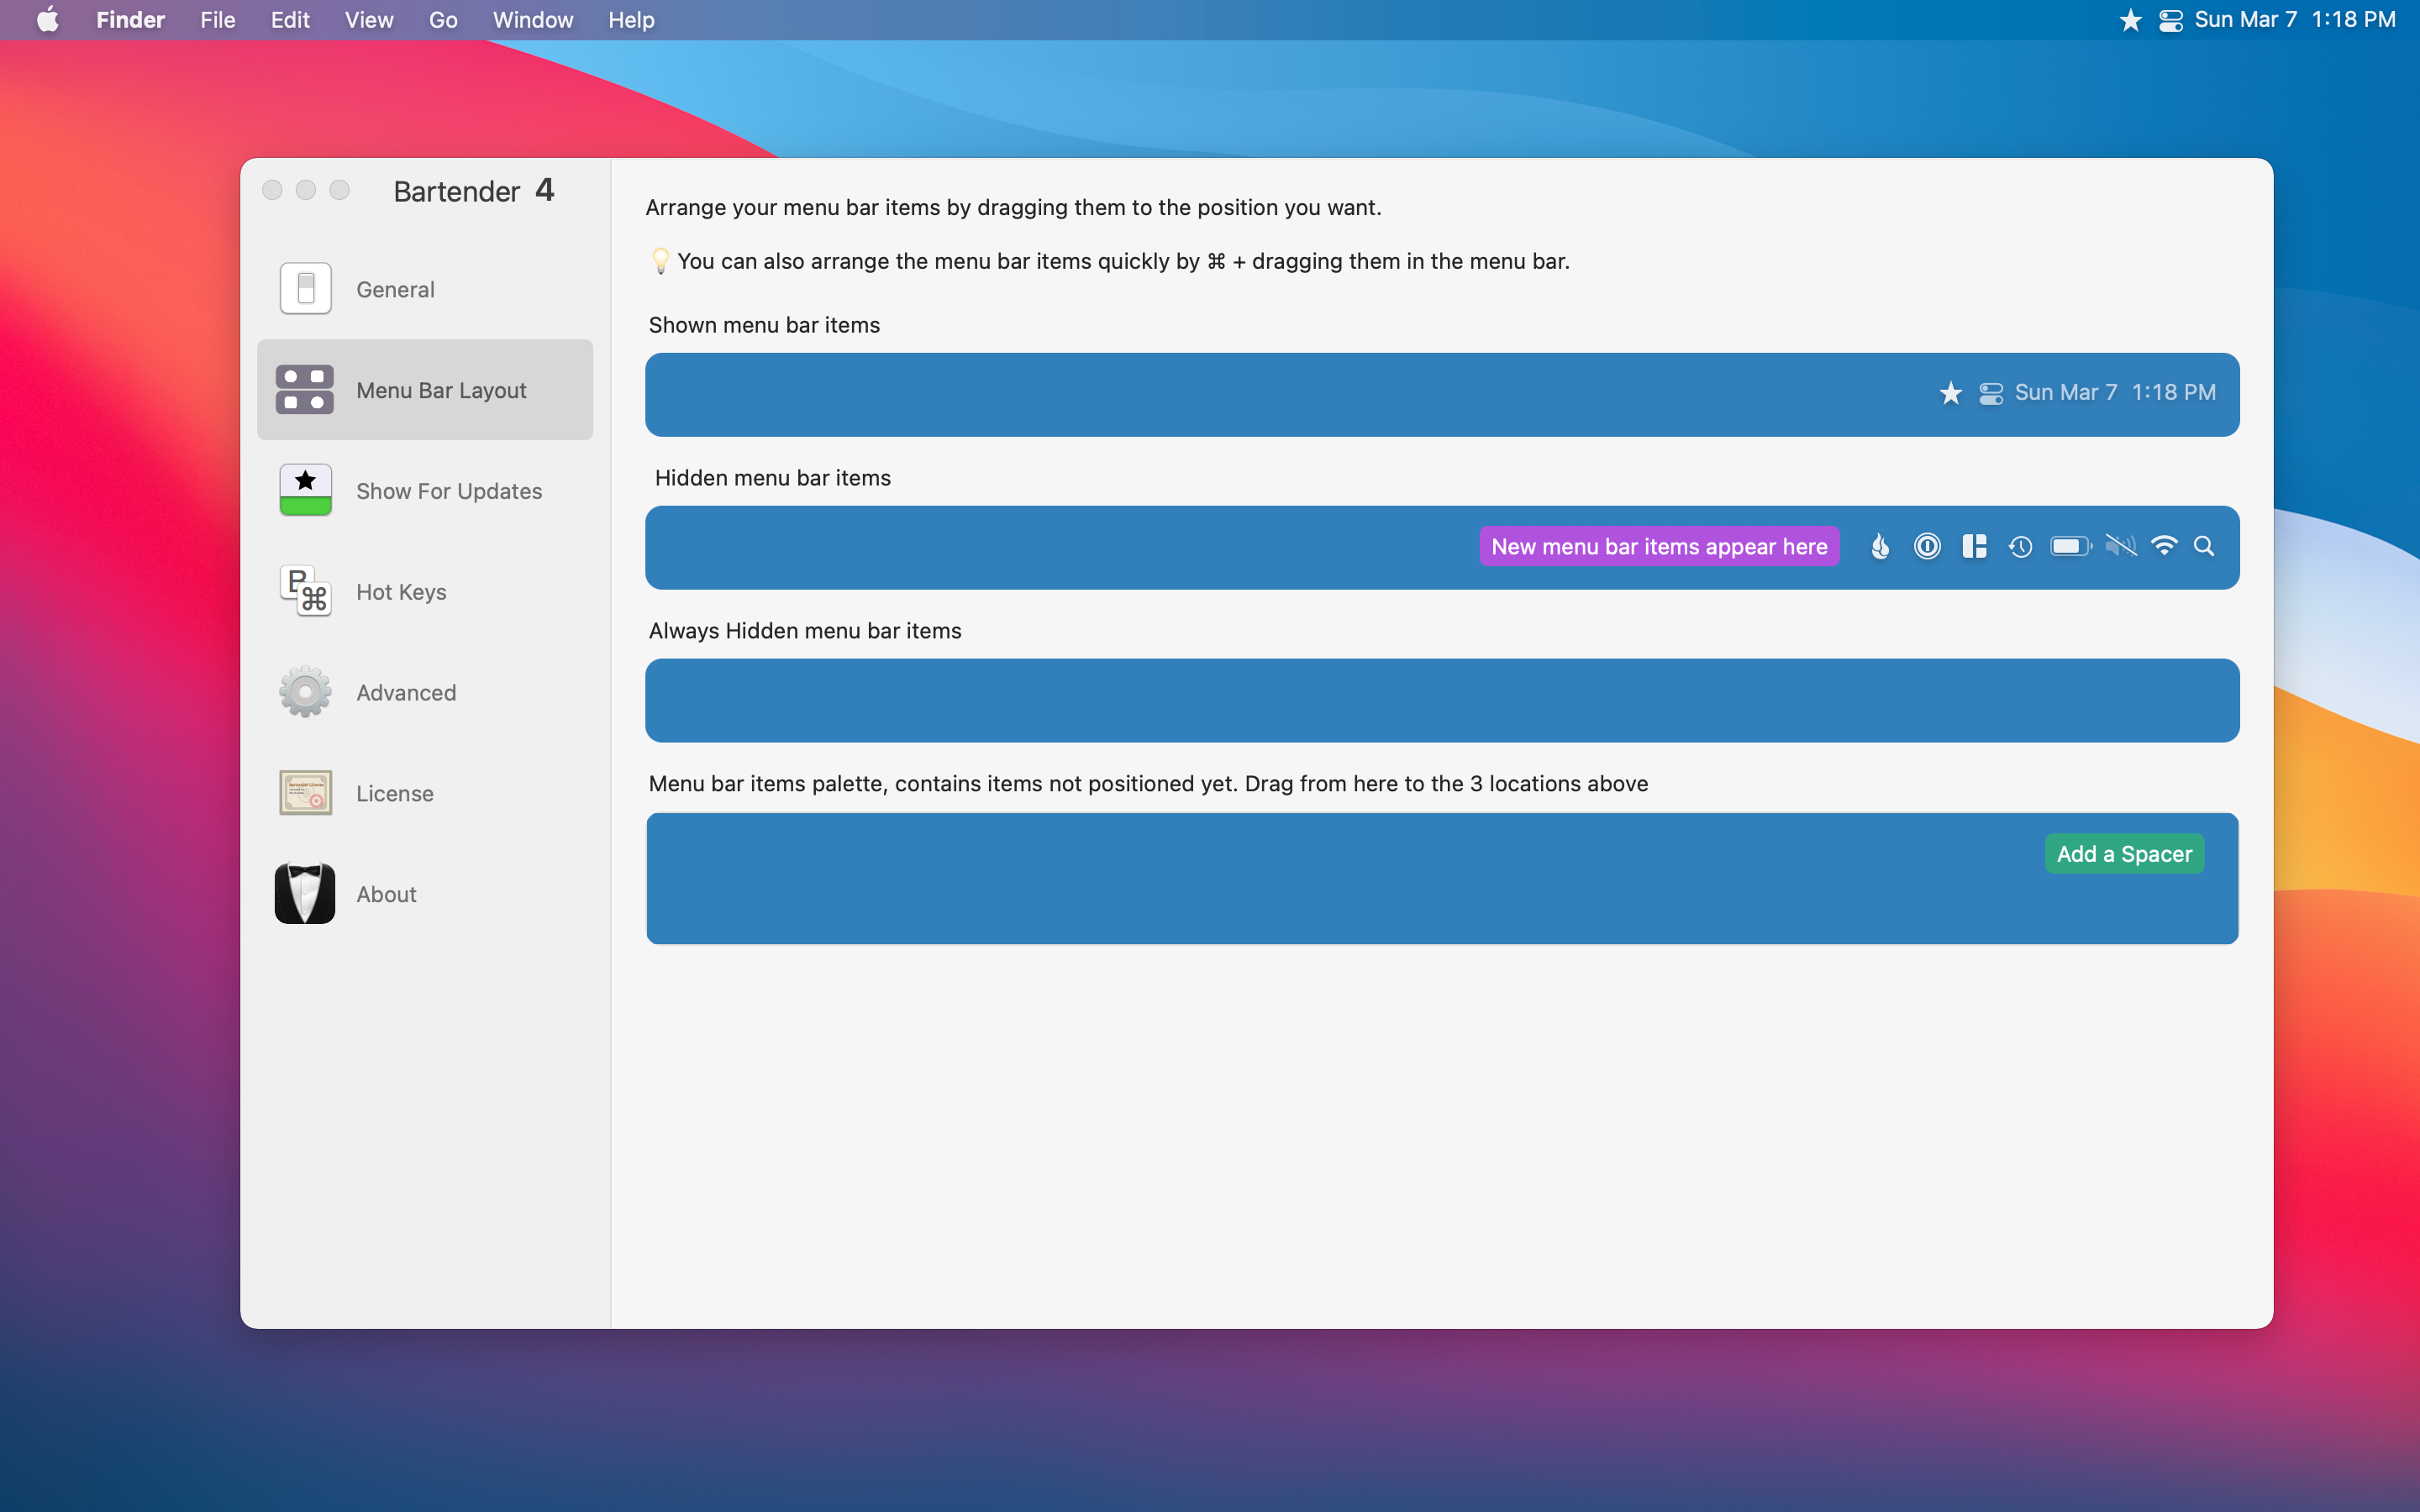
Like I said before, this had been around for a while. The simple feature is that it hides all of your menu items to give you a cleaner-looking menu bar. You also have a few options on what you want the main icon to be, like a pair of sunglasses, three dots, or a star.
Bartender doesn’t stop there, though; you are also given an abundance of options to choose from in how you want each menu icon to be. You can either hide specific menu icons in Bartender, not visible at all, or always visible.
Bartender 4 is available for macOS Big Sur and is currently in a Public Beta so it is free whilst still in beta. Pretty soon though it will cost $15 once the beta is not longer active. For anyone using an older macOS version Bartender 3 is still available to purchase.
It is a simple tool that provides a simple solution that keeps your menu bar clear of clutter. I know many have a ton of menu icons and find Bartender even more useful to manage and maintain.
Magnet ($7.99)
Window management on Mac is something you either love or hate. Many love iPadOS because window management is very structured and limited. On the Mac, you can overlap windows for days which can create chaos for some.
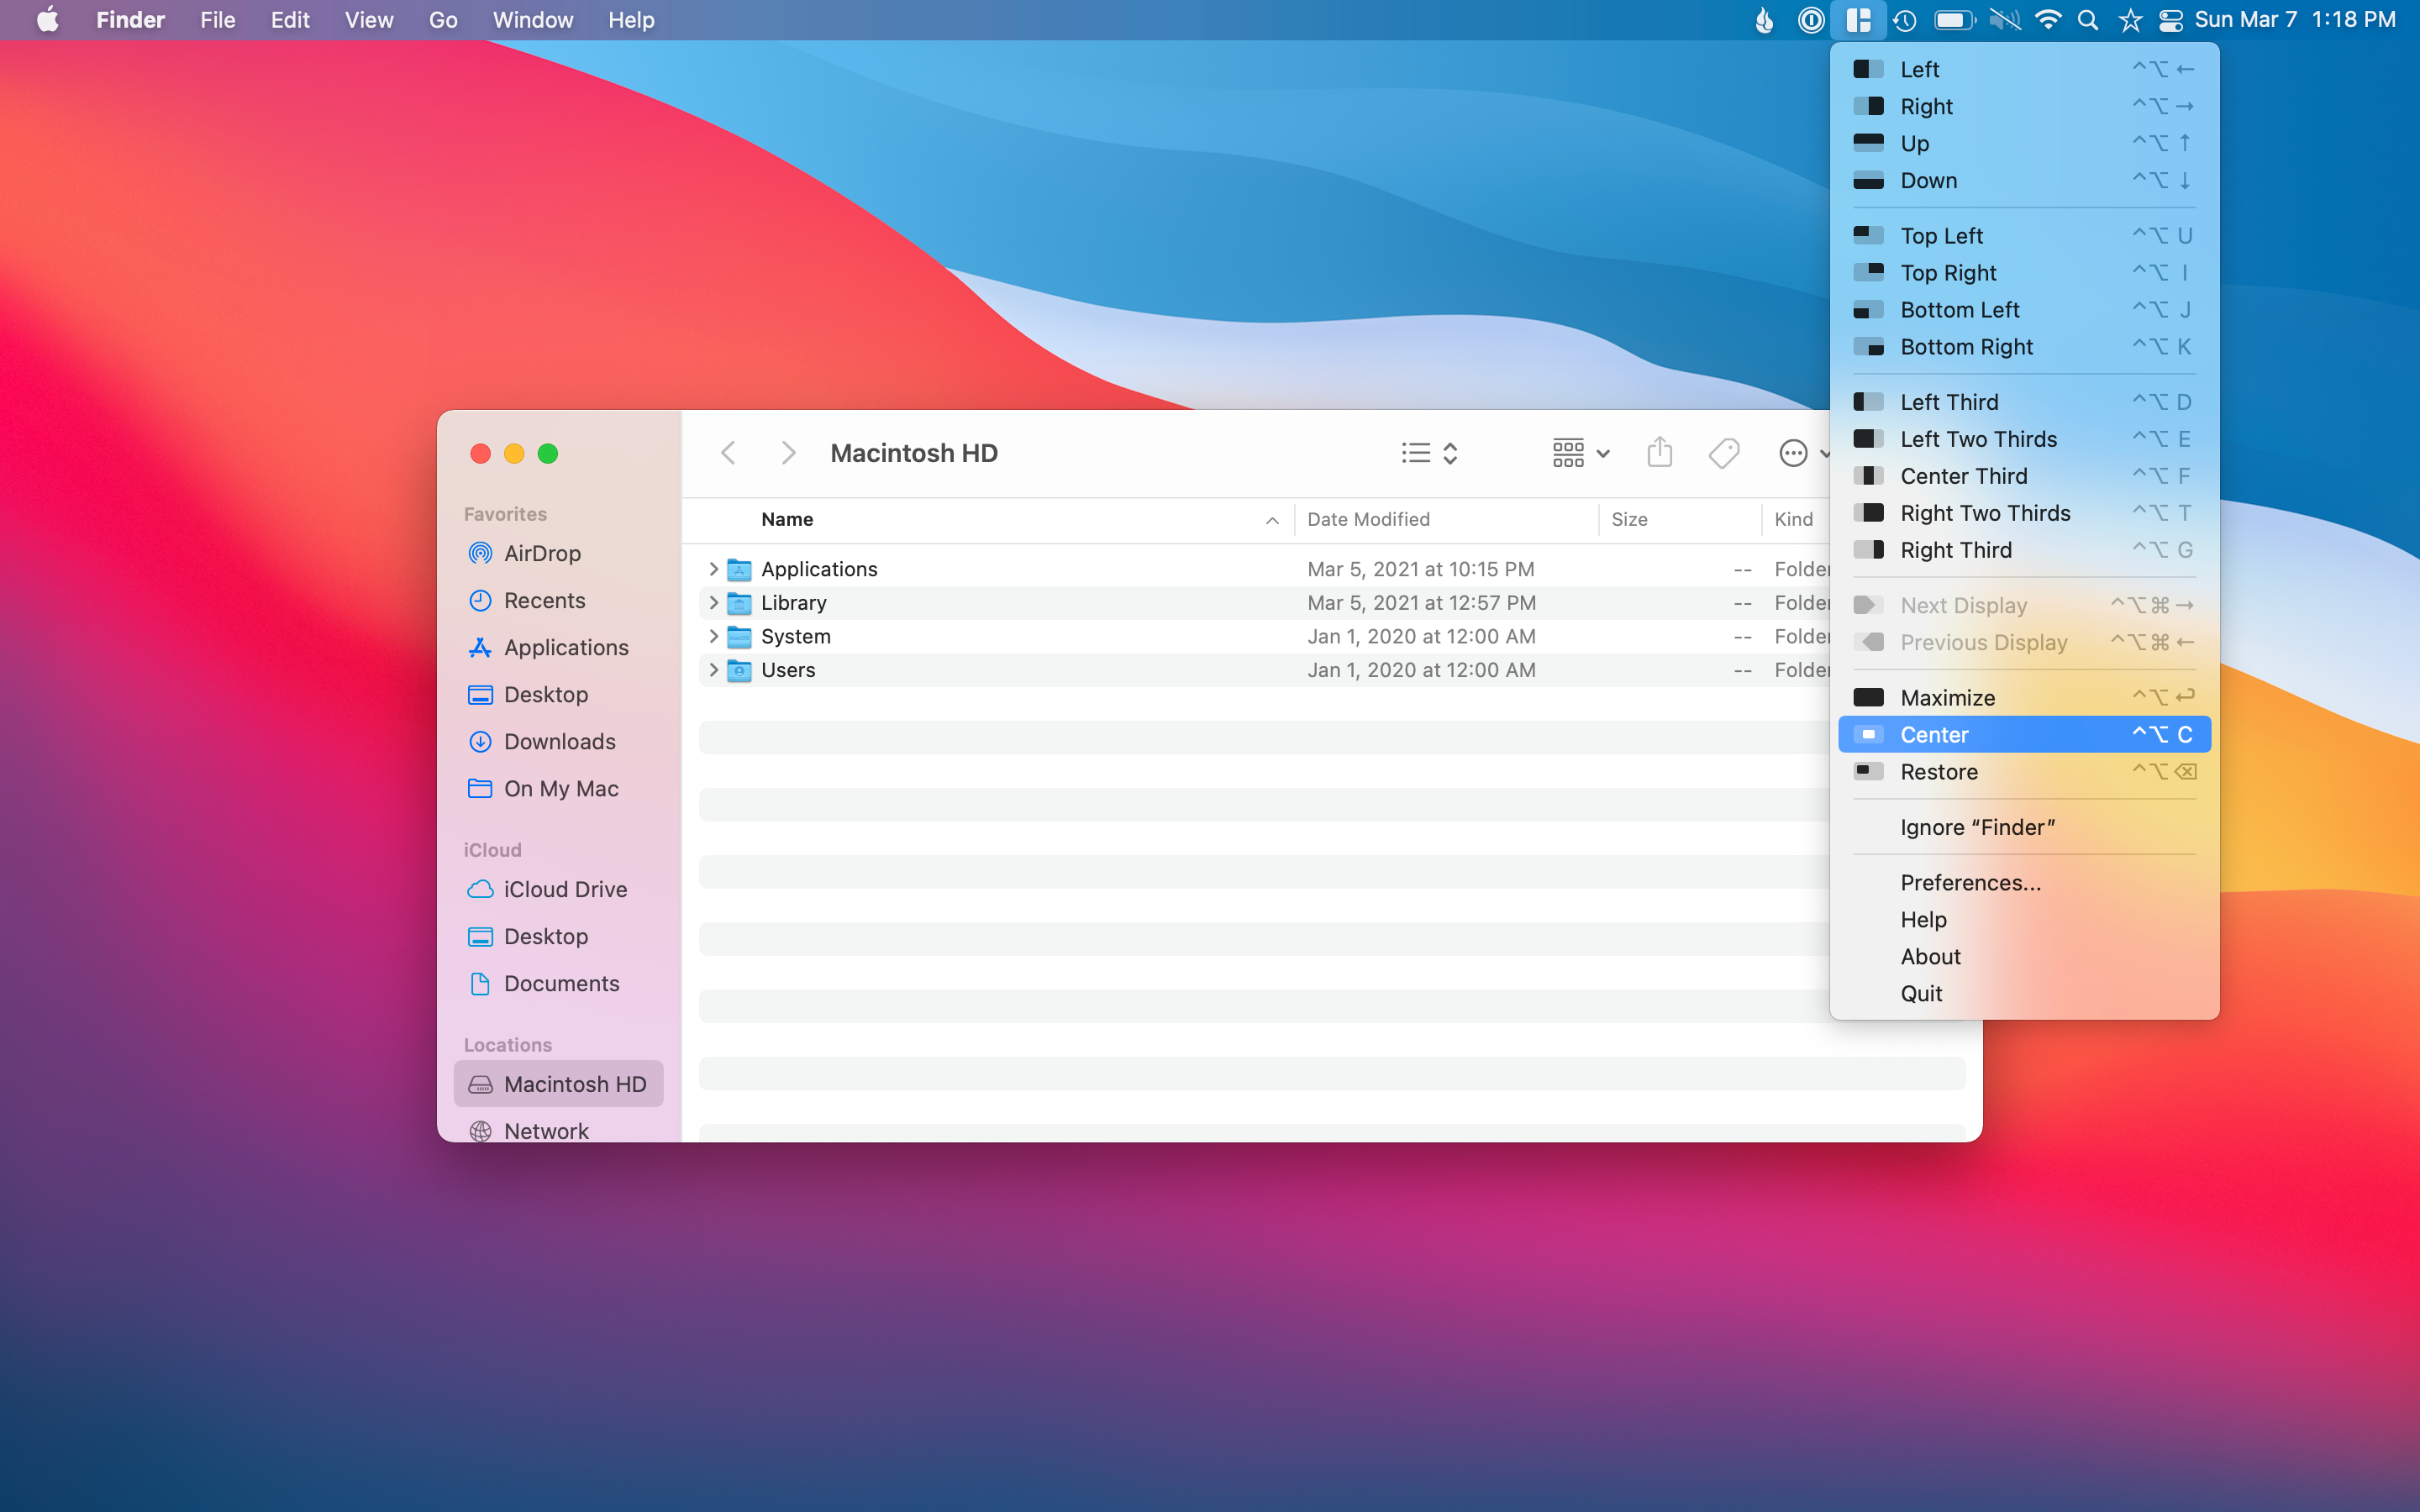
Magnet tries to help with window management on the Mac by providing options to move and resize windows with a simple click. A few examples of how I like to use Magnet would be wanting to center something on my desktop or make the app go full-size without entering full-screen mode.
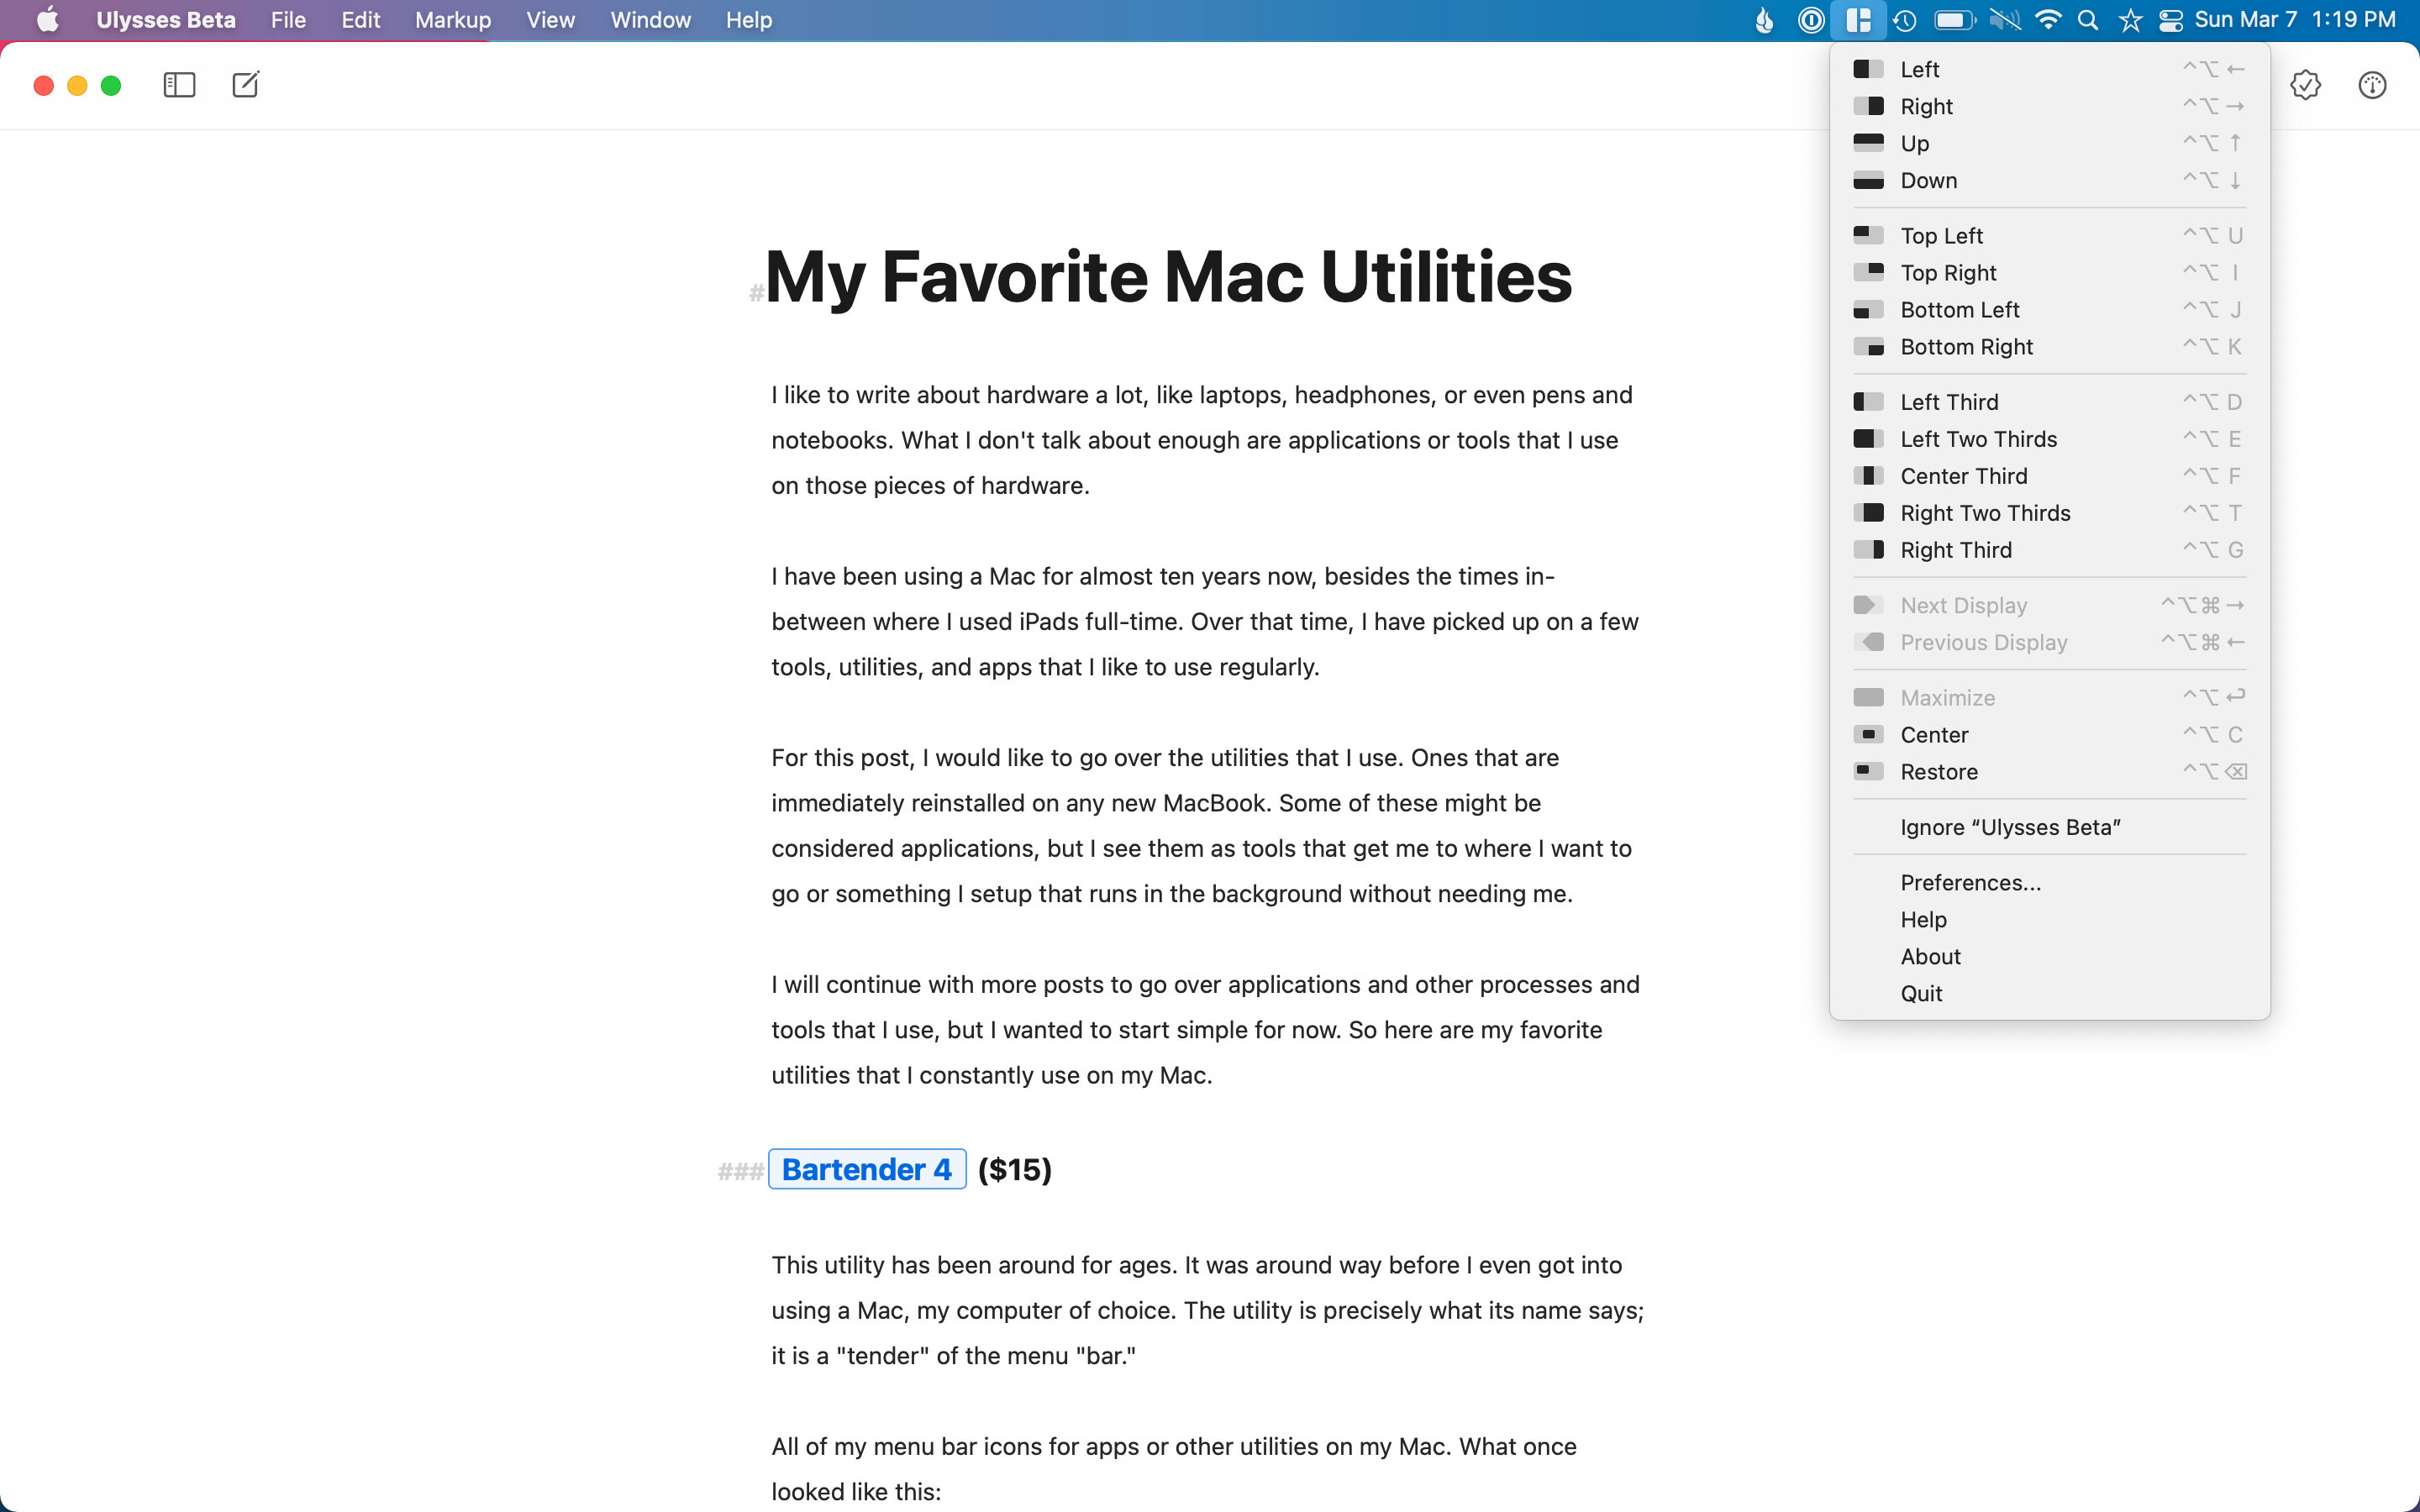
I like to maximize Ulysses instead of going full screen, so I have the menu bar at the top always visible for me. All it takes is for me to open the app then click the maximize option in Magnet. On a separate desktop, I like to have Twitter taking up one-third of the screen and email taking up the other two-thirds of the screen.
Magnet is excellent if you like to have many windows and want a quick way of organizing or resizing without having to drag the windows around manually.
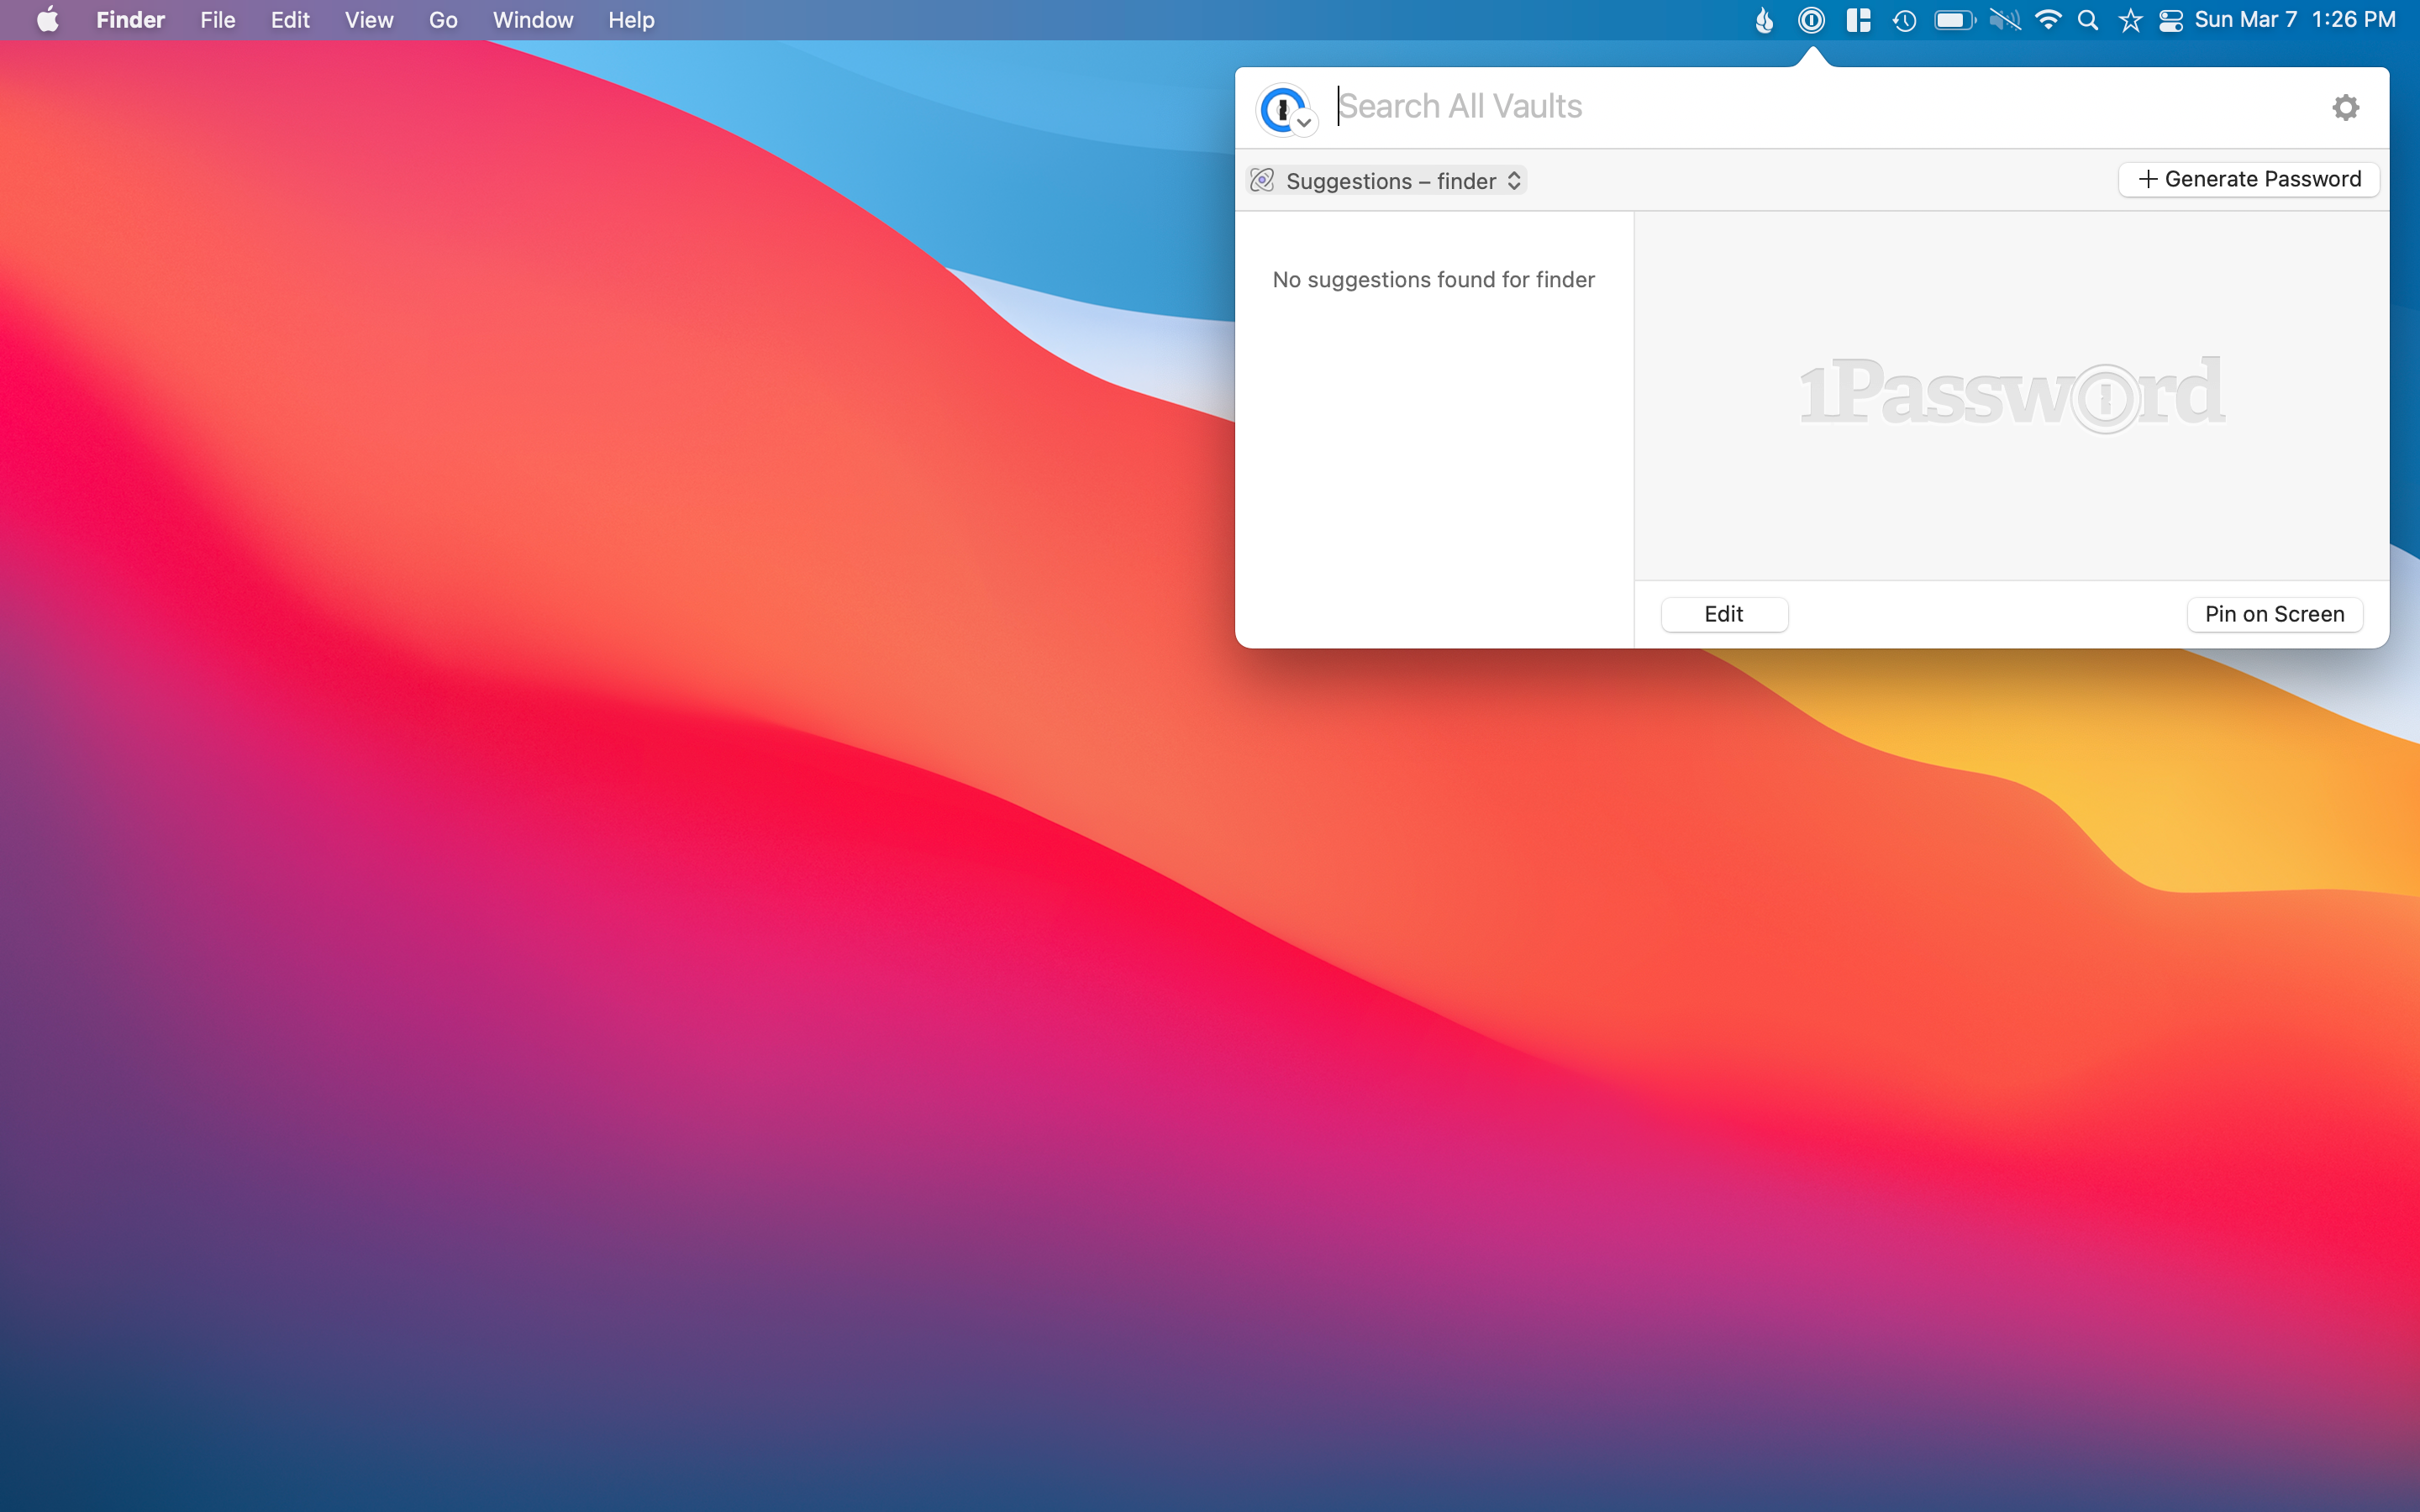
Spotlight (Quicksilver)

Once I memorized the command+space bar keyboard shortcut to bring up Spotlight, I have since only launched apps this way and have set my dock to auto-hide. I know Spotlight has been around for a while, but it wasn’t just a couple of years that I started using it more.
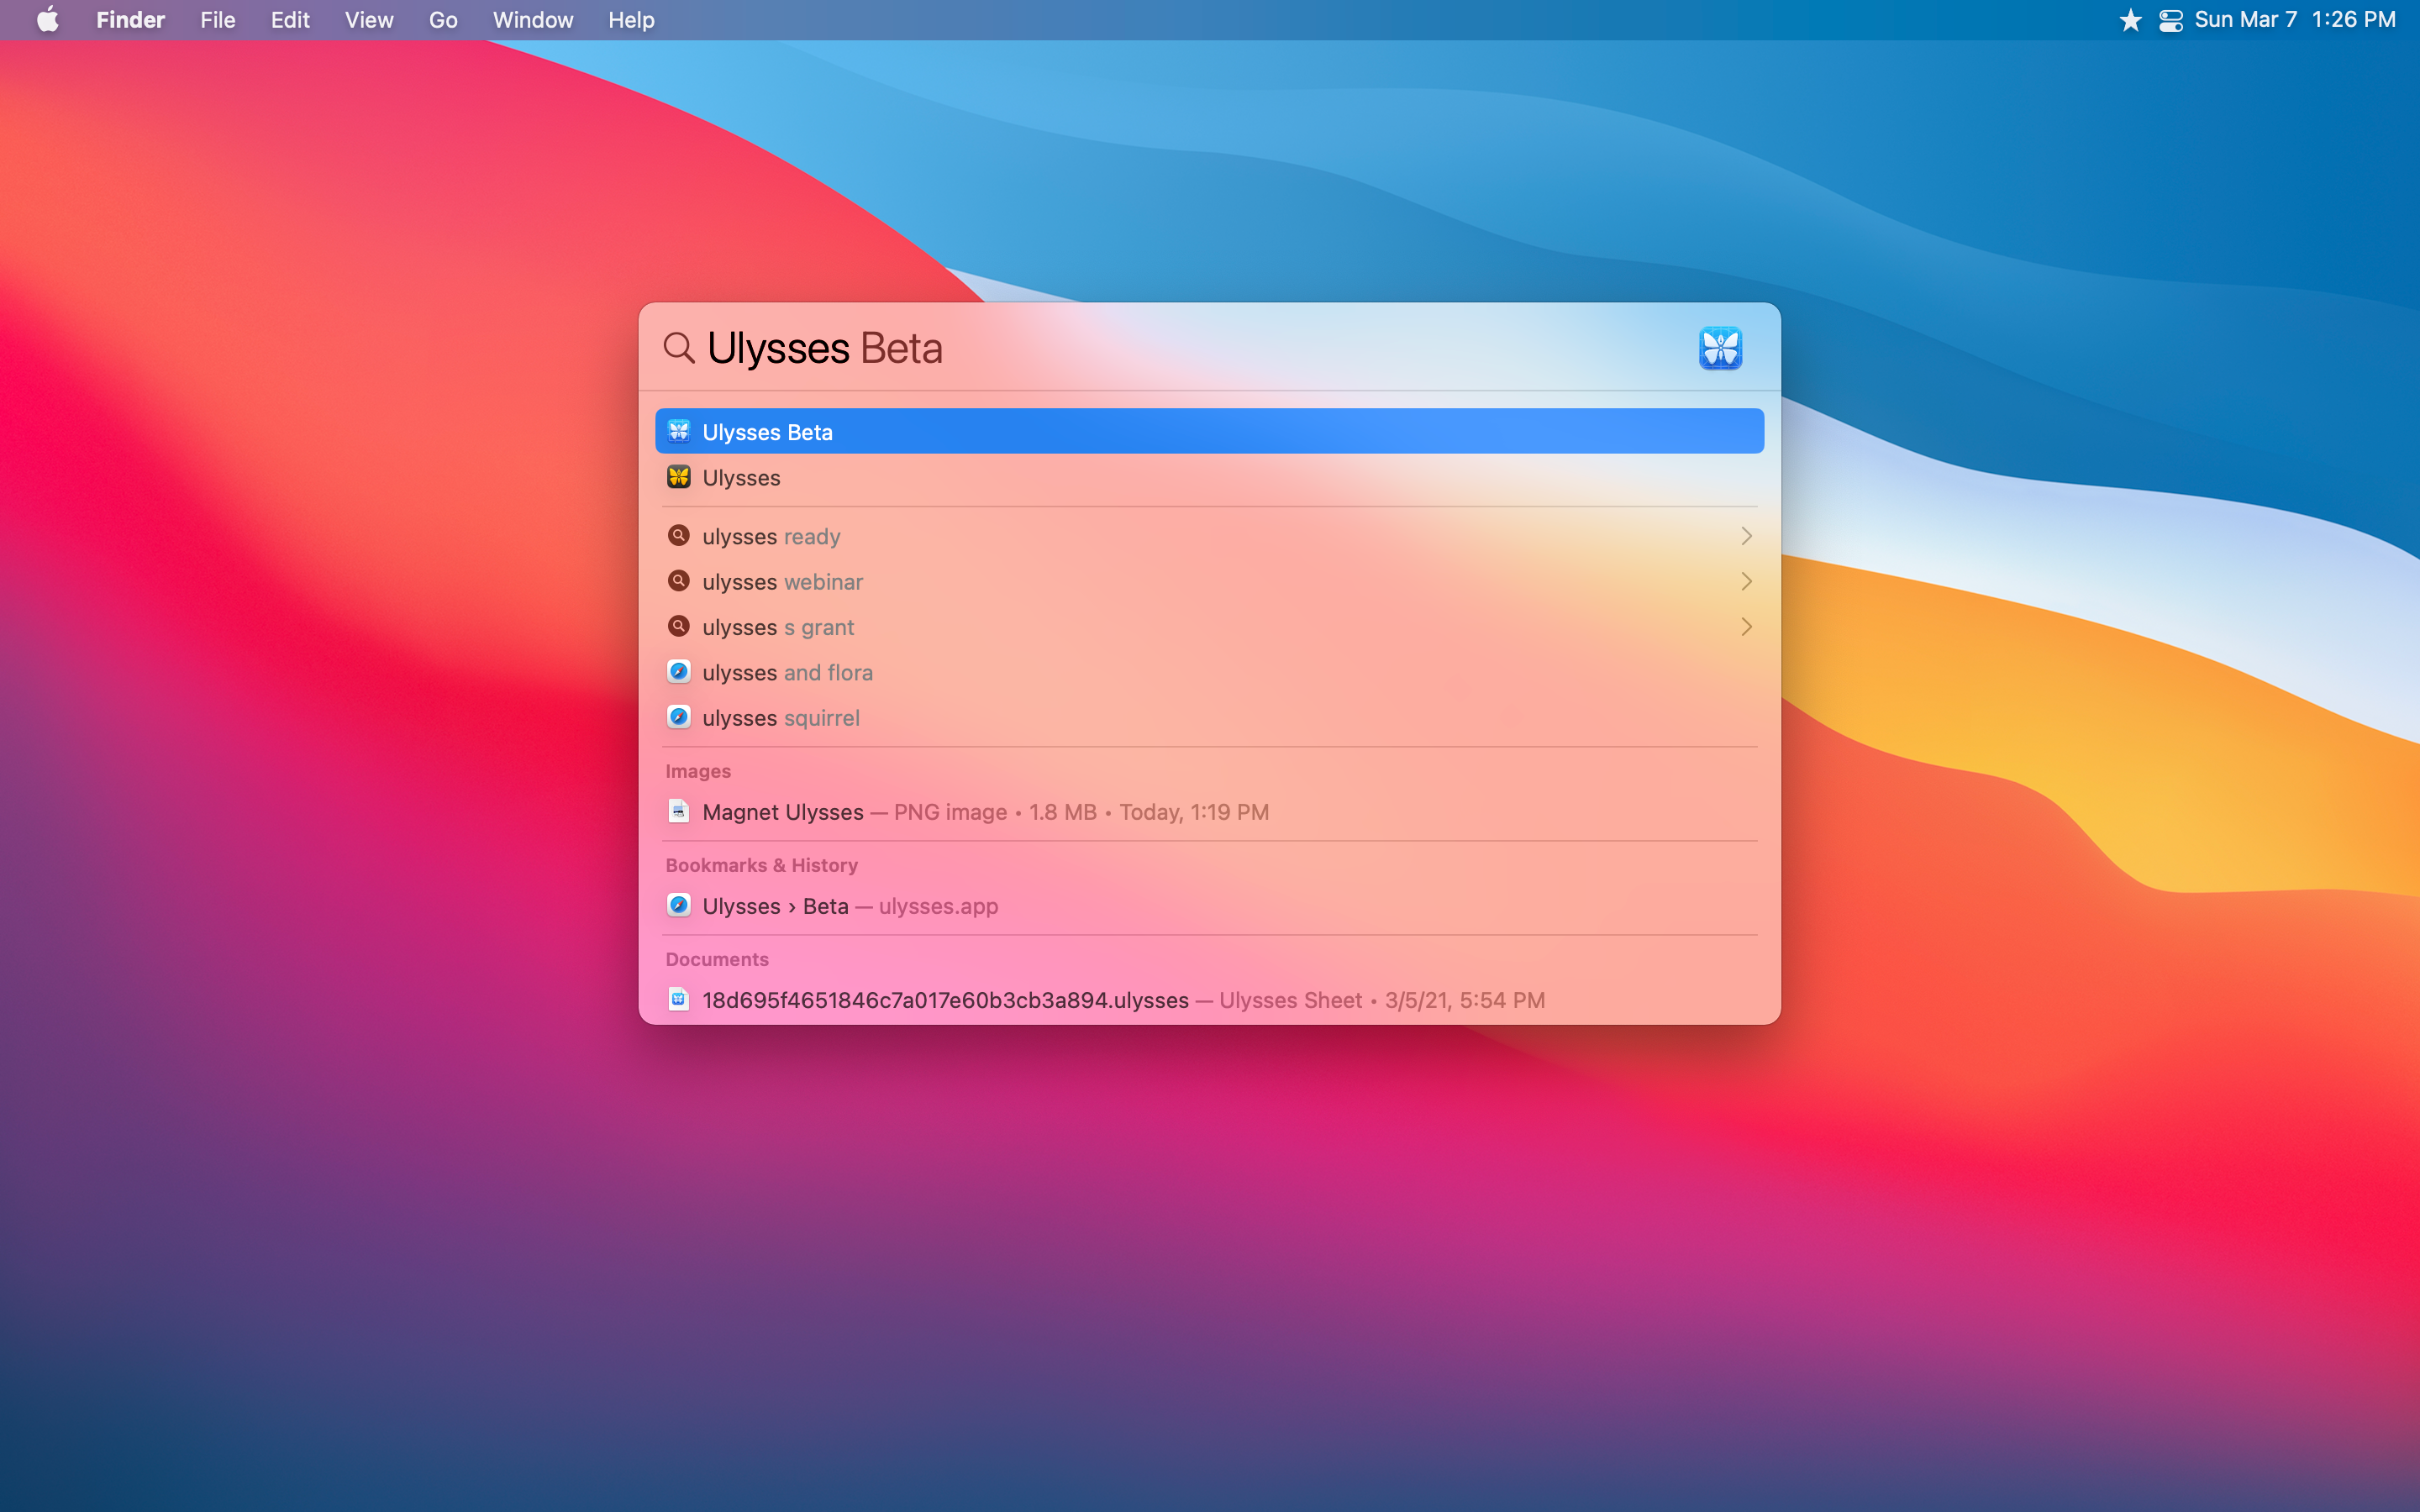
What is excellent about Spotlight is that you can do more than just search for apps and launch them. You can search for documents, emails, music, and even search the web for items straight from the text box.
For many years Spotlight was limited in what features it provided, limited to only search for local things. But over time, it has grown and now offers many things that Quicksilver has done for many years. Quicksilver also provides automation and other features, but for a simple search tool for everything on your Mac, Spotlight does the job well.

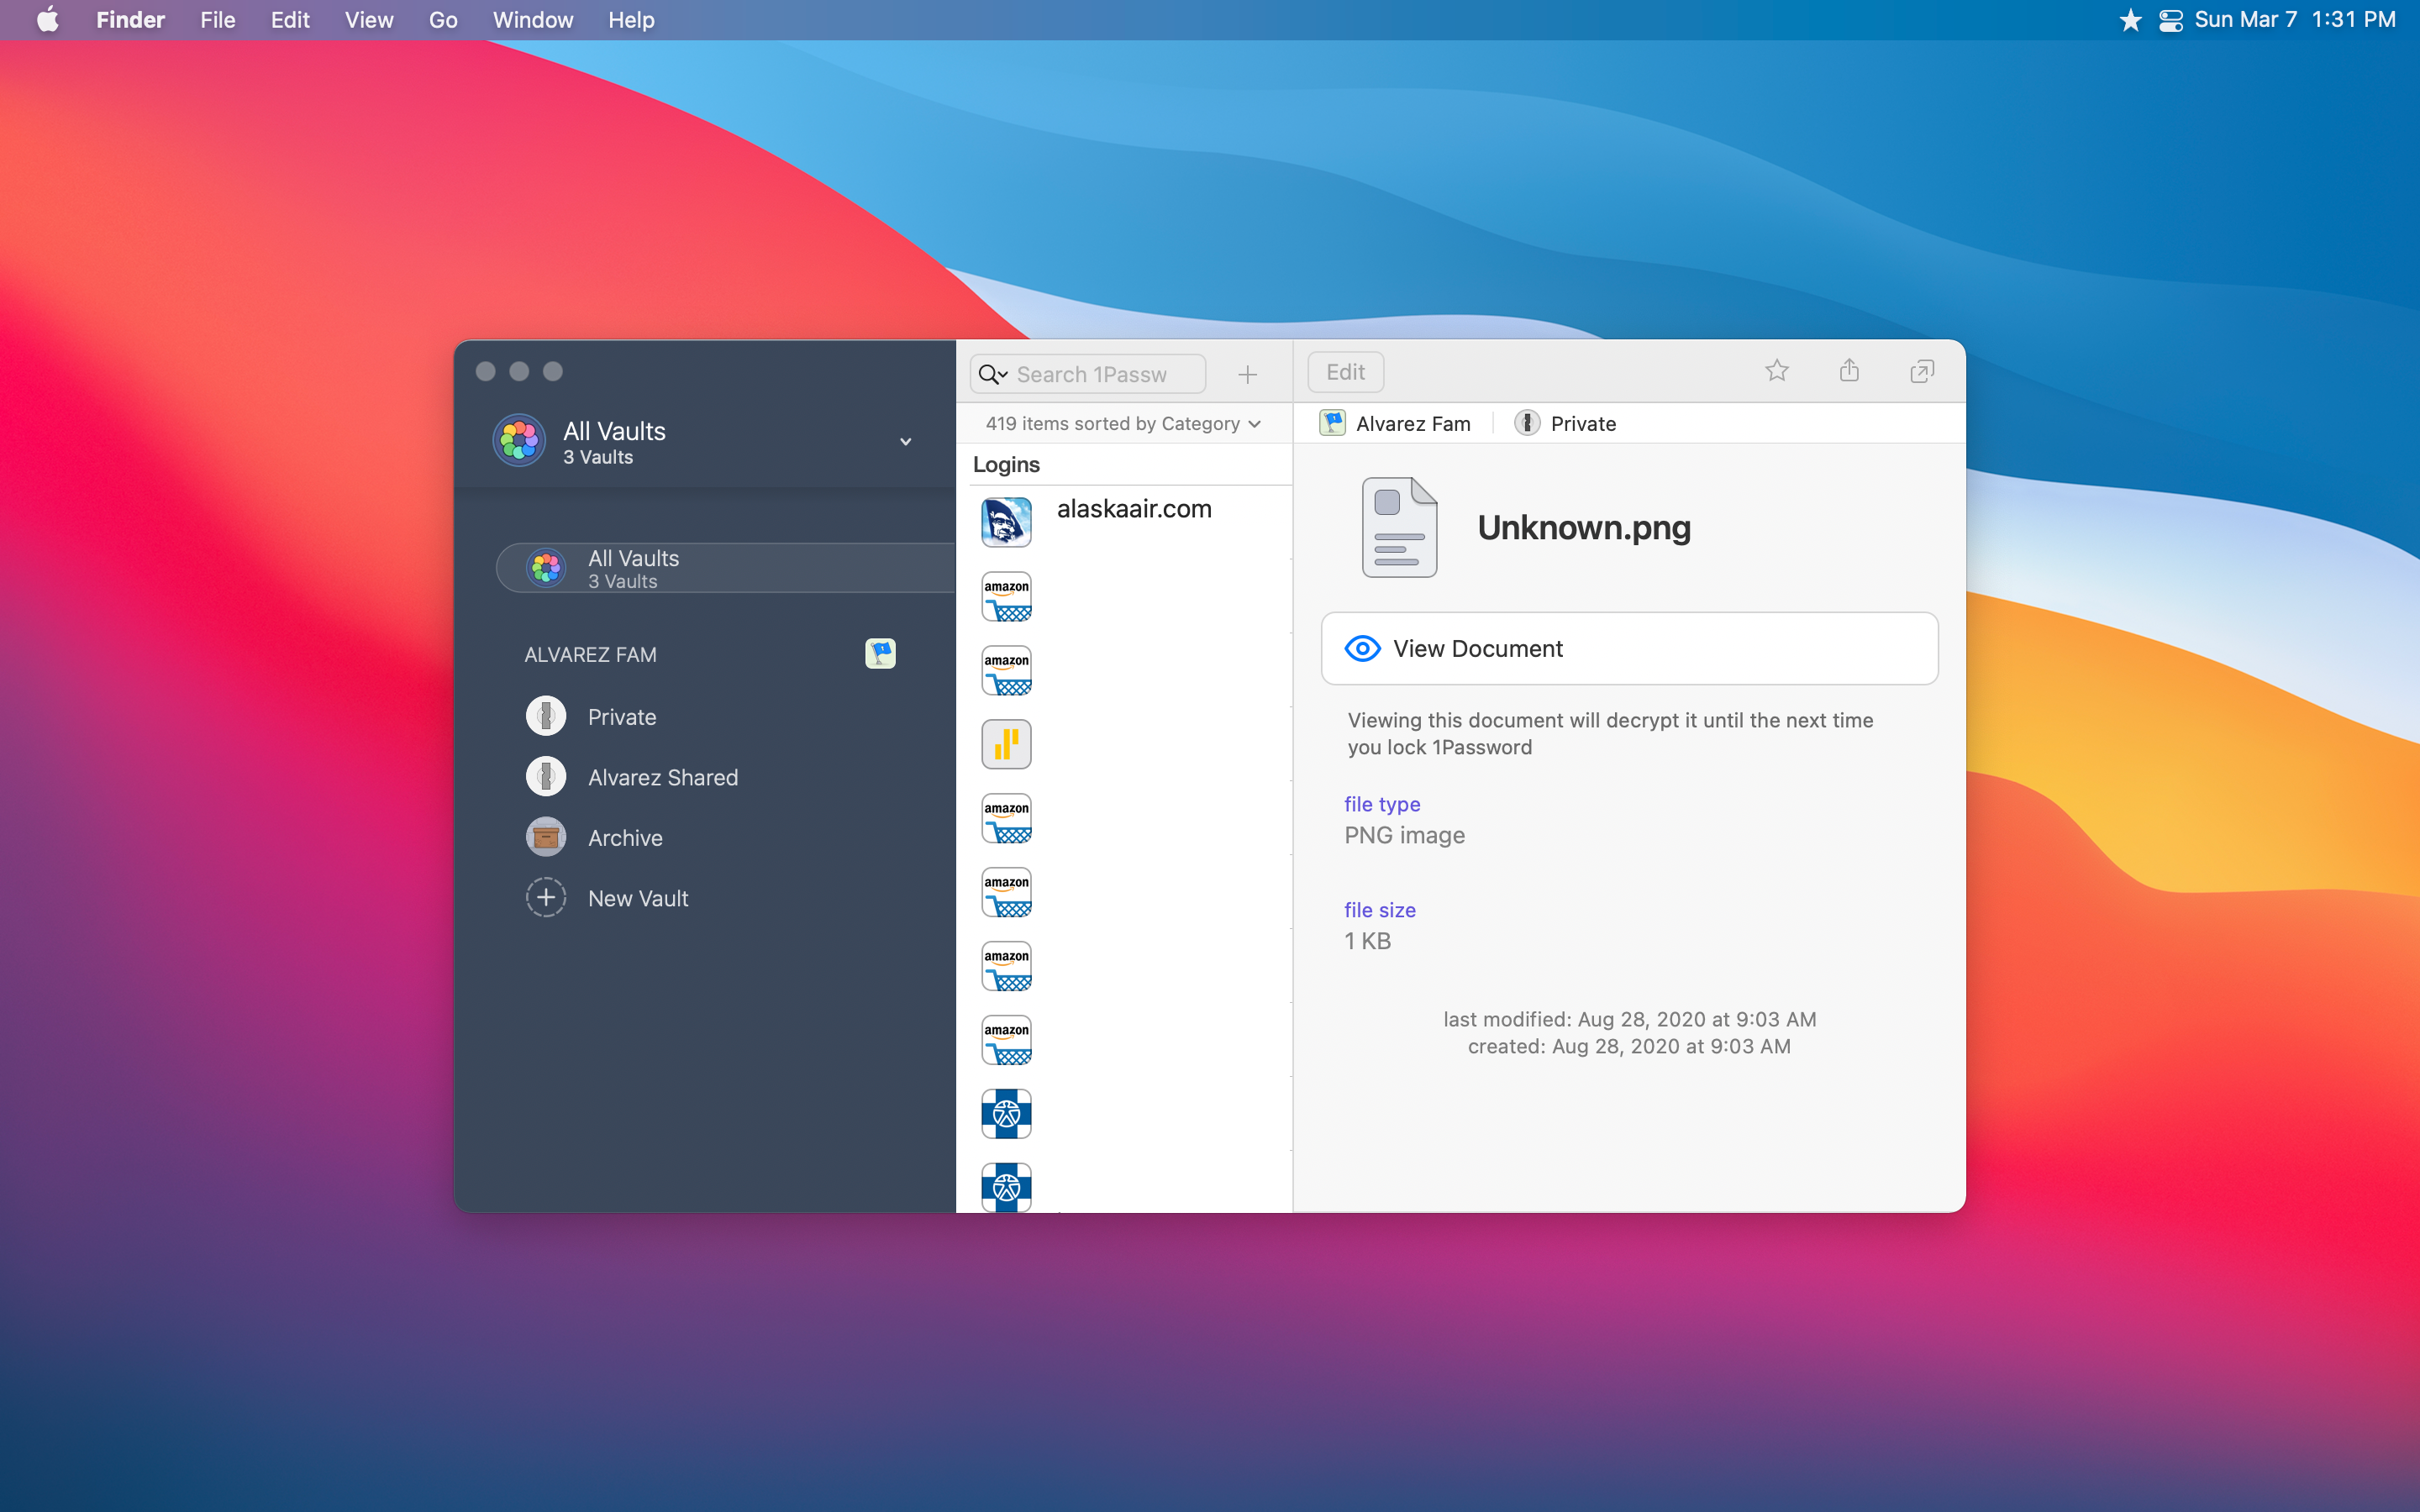
1Password ($6.99 monthly, $59.99 annually)
Passwords are a pain to keep track of, especially when you want to have safe passwords for each one of your online services. Apple’s iCloud Keychain is excellent, but I wanted something that I could share with my wife.
Not to go too dark, but this utility and the next are things that give me peace of mind not only in case of my devices breaking but if I were to disappear somehow. Death is never something many like to think about but, for me, knowing that I have certain things set up for my wife to handle a difficult situation with a bit more ease is worth it.
1Password offers a personal vault for me to keep track of all the logins I could ever think of; it even lets you set up two-factor authentication for logins that I have set up and will copy that one-time password when using 1Password on my iPhone and iPad.
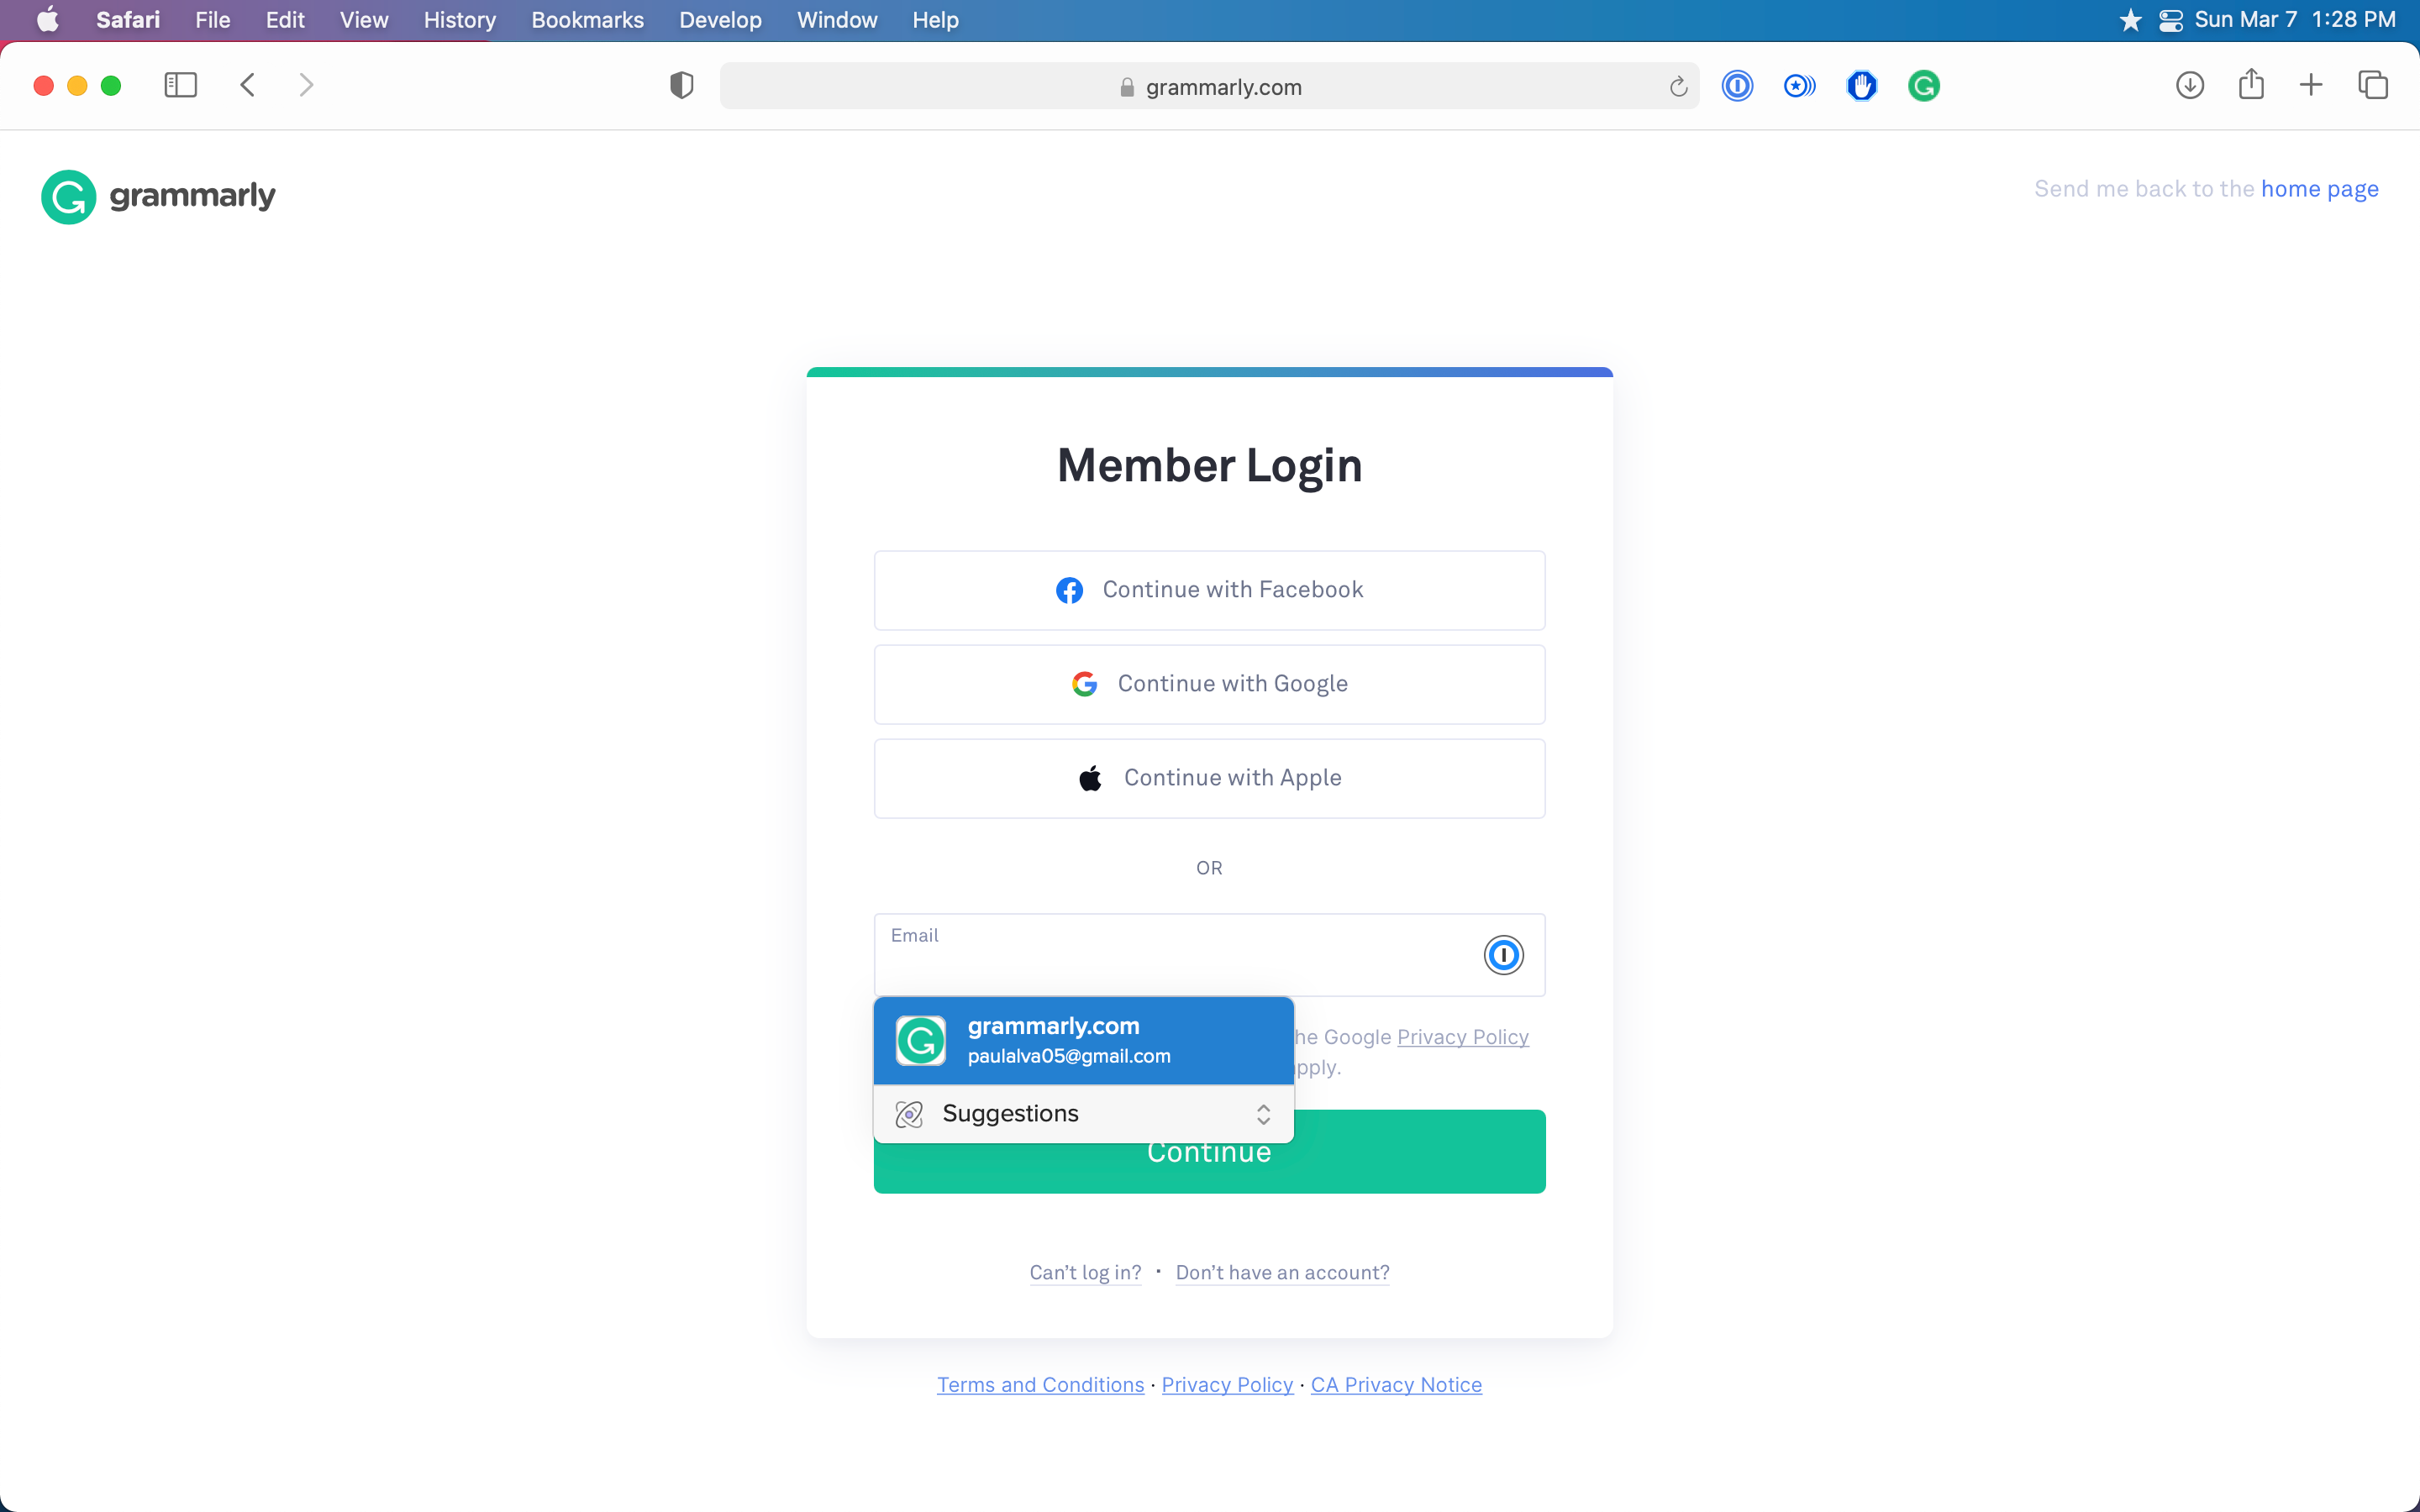
The best part is shared vaults, though. The fact that my wife and I have all of our more crucial logins in this shared vault is so useful, not only if something happens to one of us and we need a login only one of us has, but if I need to login to something of hers when she can’t log in herself, I have access with a simple click.
Backblaze ($6 a month)
This utility is purely just peace of mind. I have always had Backblaze on my and my wife’s MacBook as soon as I learned about its existence years ago. It is a cheap offsite backup service that just works.
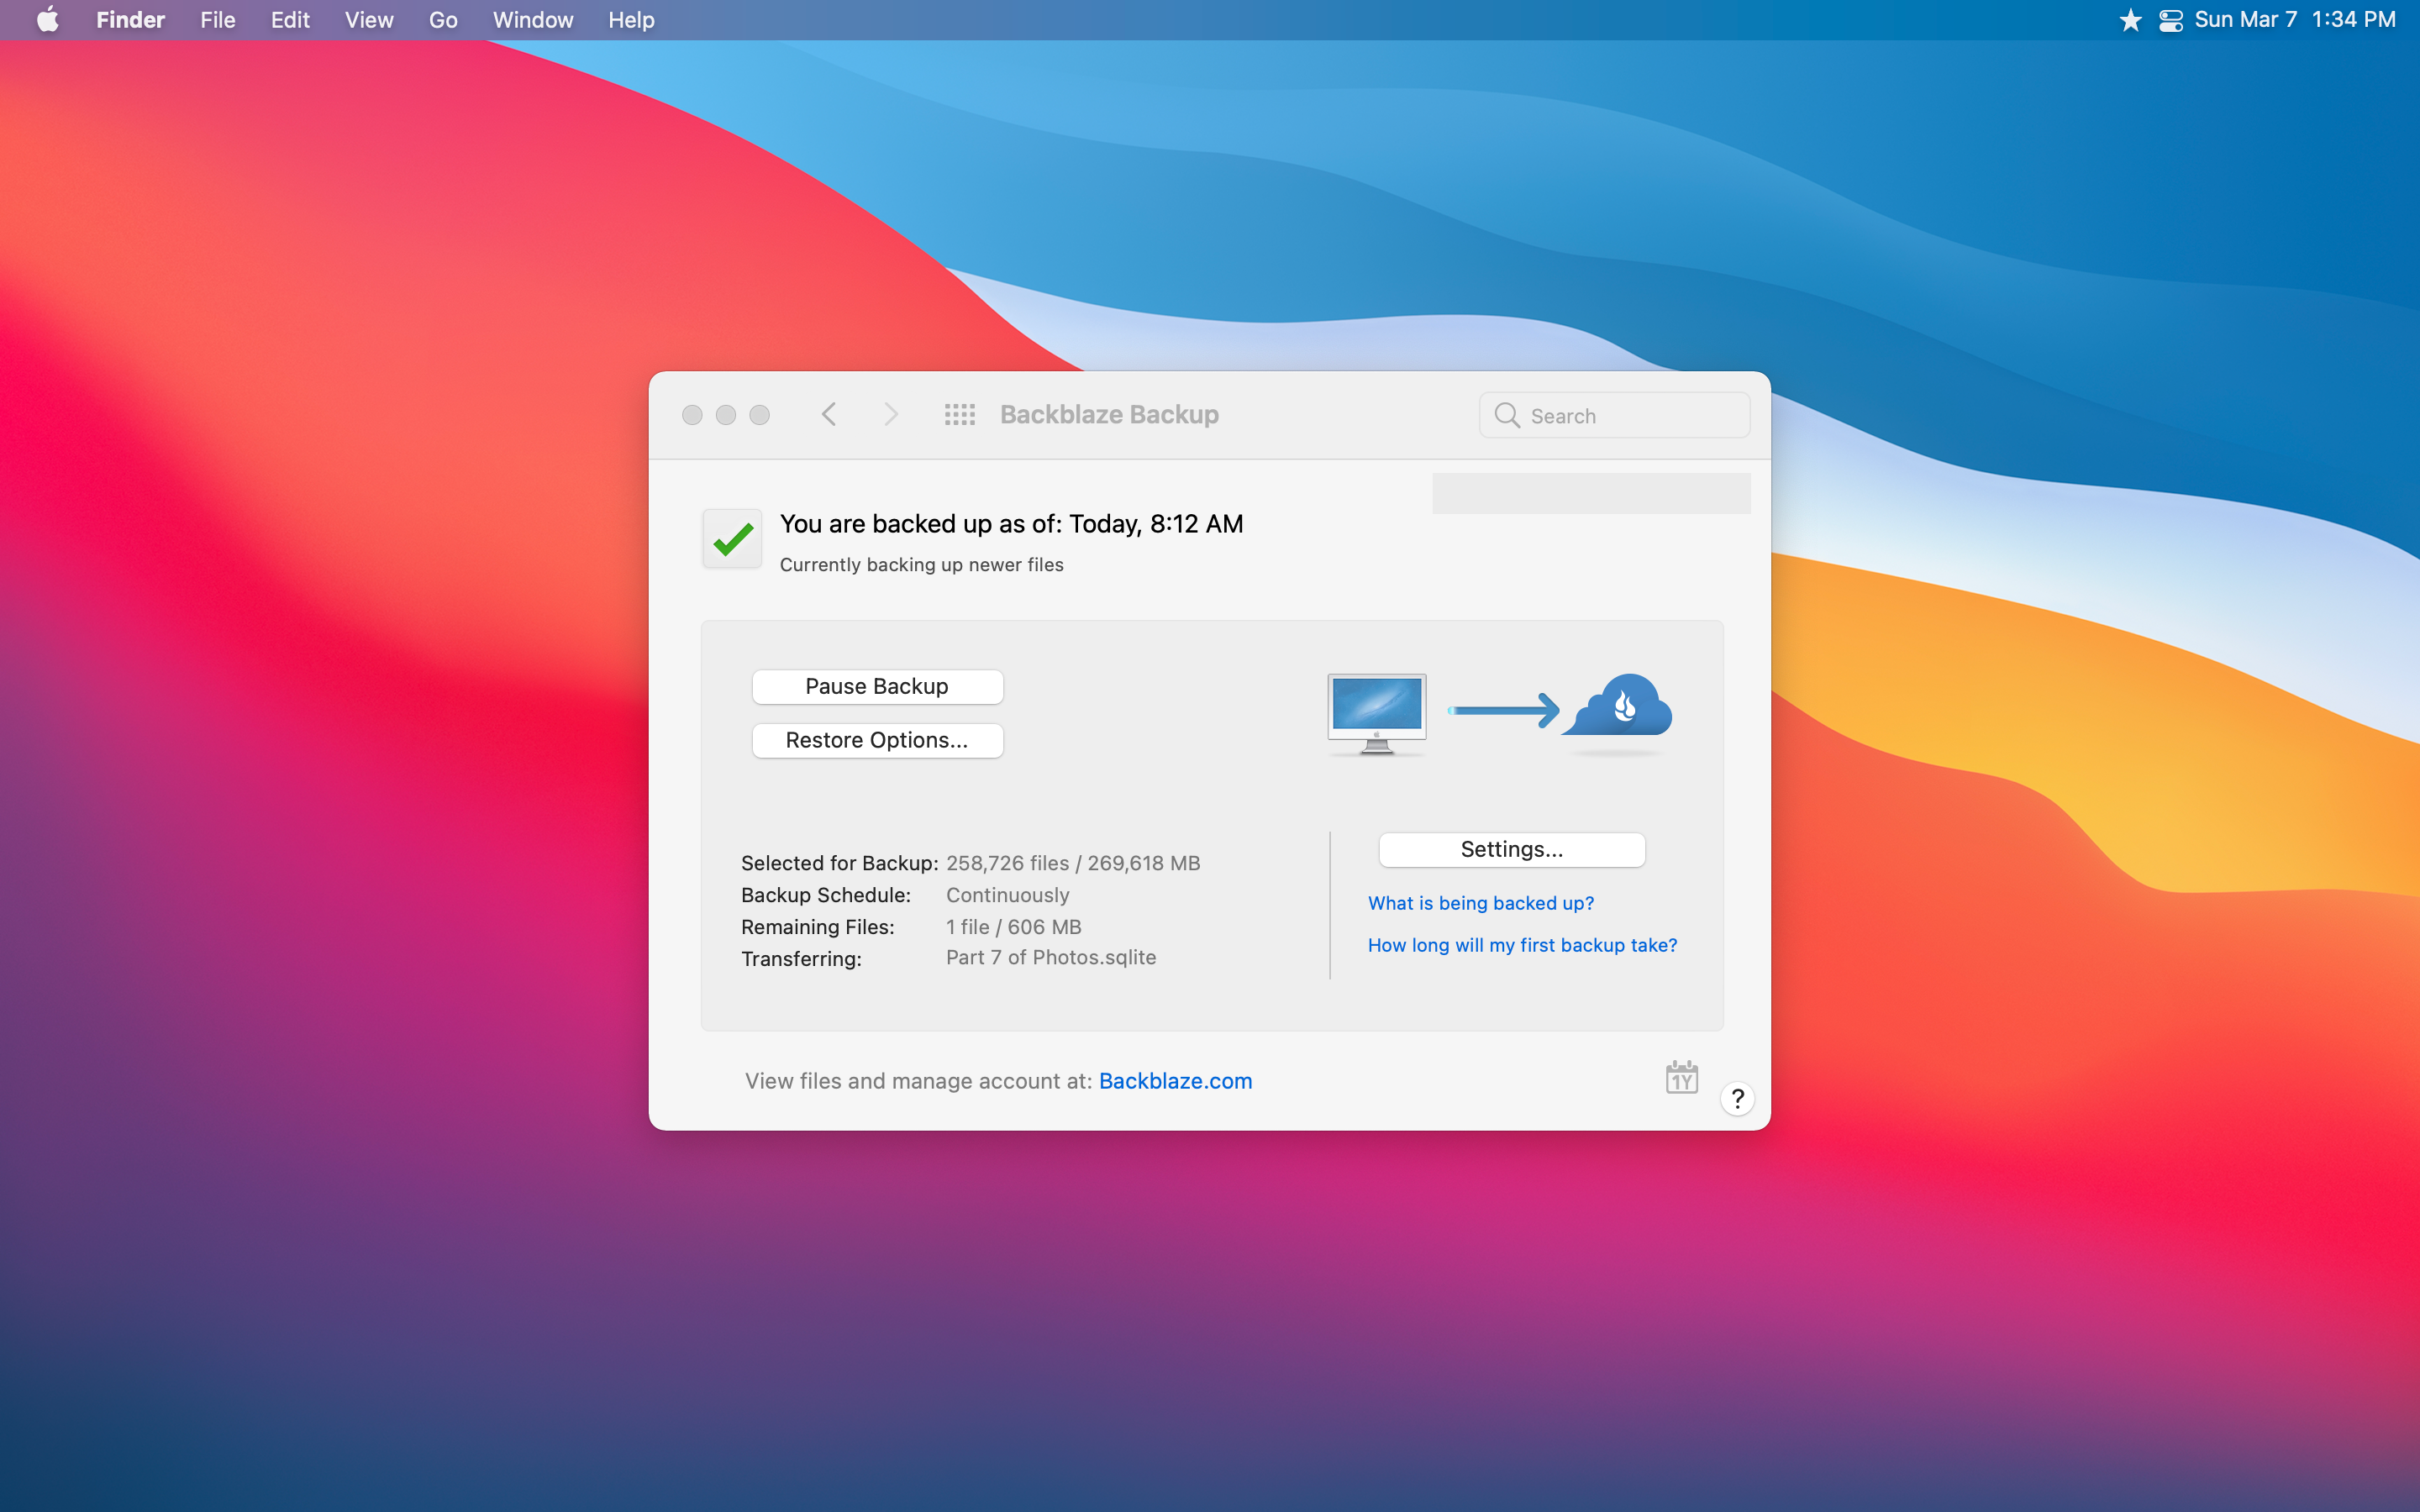
For many years it offered unlimited backups for a single computer and any external drives plugged in for $5 a month. It has recently upped that price to $6, but I still think it is a killer deal. I not only have my over 300 GB of data on my MacBook Air backed up, but I also have my 2 TB of data on my external hard drive backed up as well. All for only $6 for me.
Actually, it is possible to pay $6 for what I am doing, but I have also recently opted for another new feature that BackBlaze offers for an additional $2 more. That extra feature is 1-Year Version History, which safeguards any deleted data for up to 1 year.
So if I were to delete a file today accidentally and in six months realized I needed that file, Backblaze would still have it available in my back up to recover. They also offer Forever Version History, meaning that you can recover any file deleted ever as long as you are still a customer with them.
The Forever Version History is also $2 a month and charges $.005 per GB per month. If I were to opt into the Forever option for my wife and me, the total would cost about $12 for the standard base cost and $4 + $13.05 (2.7 TB multiplied by $0.005) total cost of about $30 a month.

$30 for 2.7 terabytes of data and Version History forever doesn’t sound so bad, but it is a little overboard for us. The $16 a month that we pay now for our laptops and 1-Year Version History is good enough.
It is an excellent option to be aware of, though, if you have a lot of data or have many family members that may benefit from long-term data recovery. Like some who have highly sensitive data, like a manuscript for a book that has been worked on for many years, want to ensure you don’t lose anything.
I have many other utilities that I use, mostly ones that come with macOS, but these are the ones that I really could not live without. My heart isn’t dead set on these specific versions either, since my primary needs are what these utilities offer.
Keeping my menu bar organized and windows managed, the ability to search for anything on my Mac with a simple keyboard command, a password manager, and reliable offsite backup software are the things that make my Mac the best that it is.
There are other utilities out there that can do similar things, but these are the ones that have worked for me consistently for years. The ultimate goal of having utilities on your Mac is to make it better — for your computer to work for you and not the other way around.
So if you have had desires to make your Mac more useful, I would check out some of the utilities I listed above or any other tools that may fit your needs more. The most crucial part is that it does not get in your way but just works for you.
Multivariate Outlier Detection in Python
Multivariate Outlier Detection in Python
Multivariate Outliers and Mahalanobis Distance in Python
Detecting outliers in multivariate data can often be one of the challenges of the data preprocessing phase. There are various distance metrics, scores, and techniques to detect outliers. Euclidean distance is one of the most known distance metrics to identify outliers based on their distance to the center point. There is also a Z-Score to define outliers for a single numeric variable. In some cases, clustering algorithms can be also preferred. All these methods consider outliers from different perspectives. The outliers are found based on one method may not be found by the others as outliers. Therefore, these methods and metrics should be chosen by considering the distribution of the variables. However, this brings out the needs of different metrics too. In this article, we will be discussing the distance metric called Mahalanobis Distance for detecting outliers in multivariable data.
Mahalonobis Distance
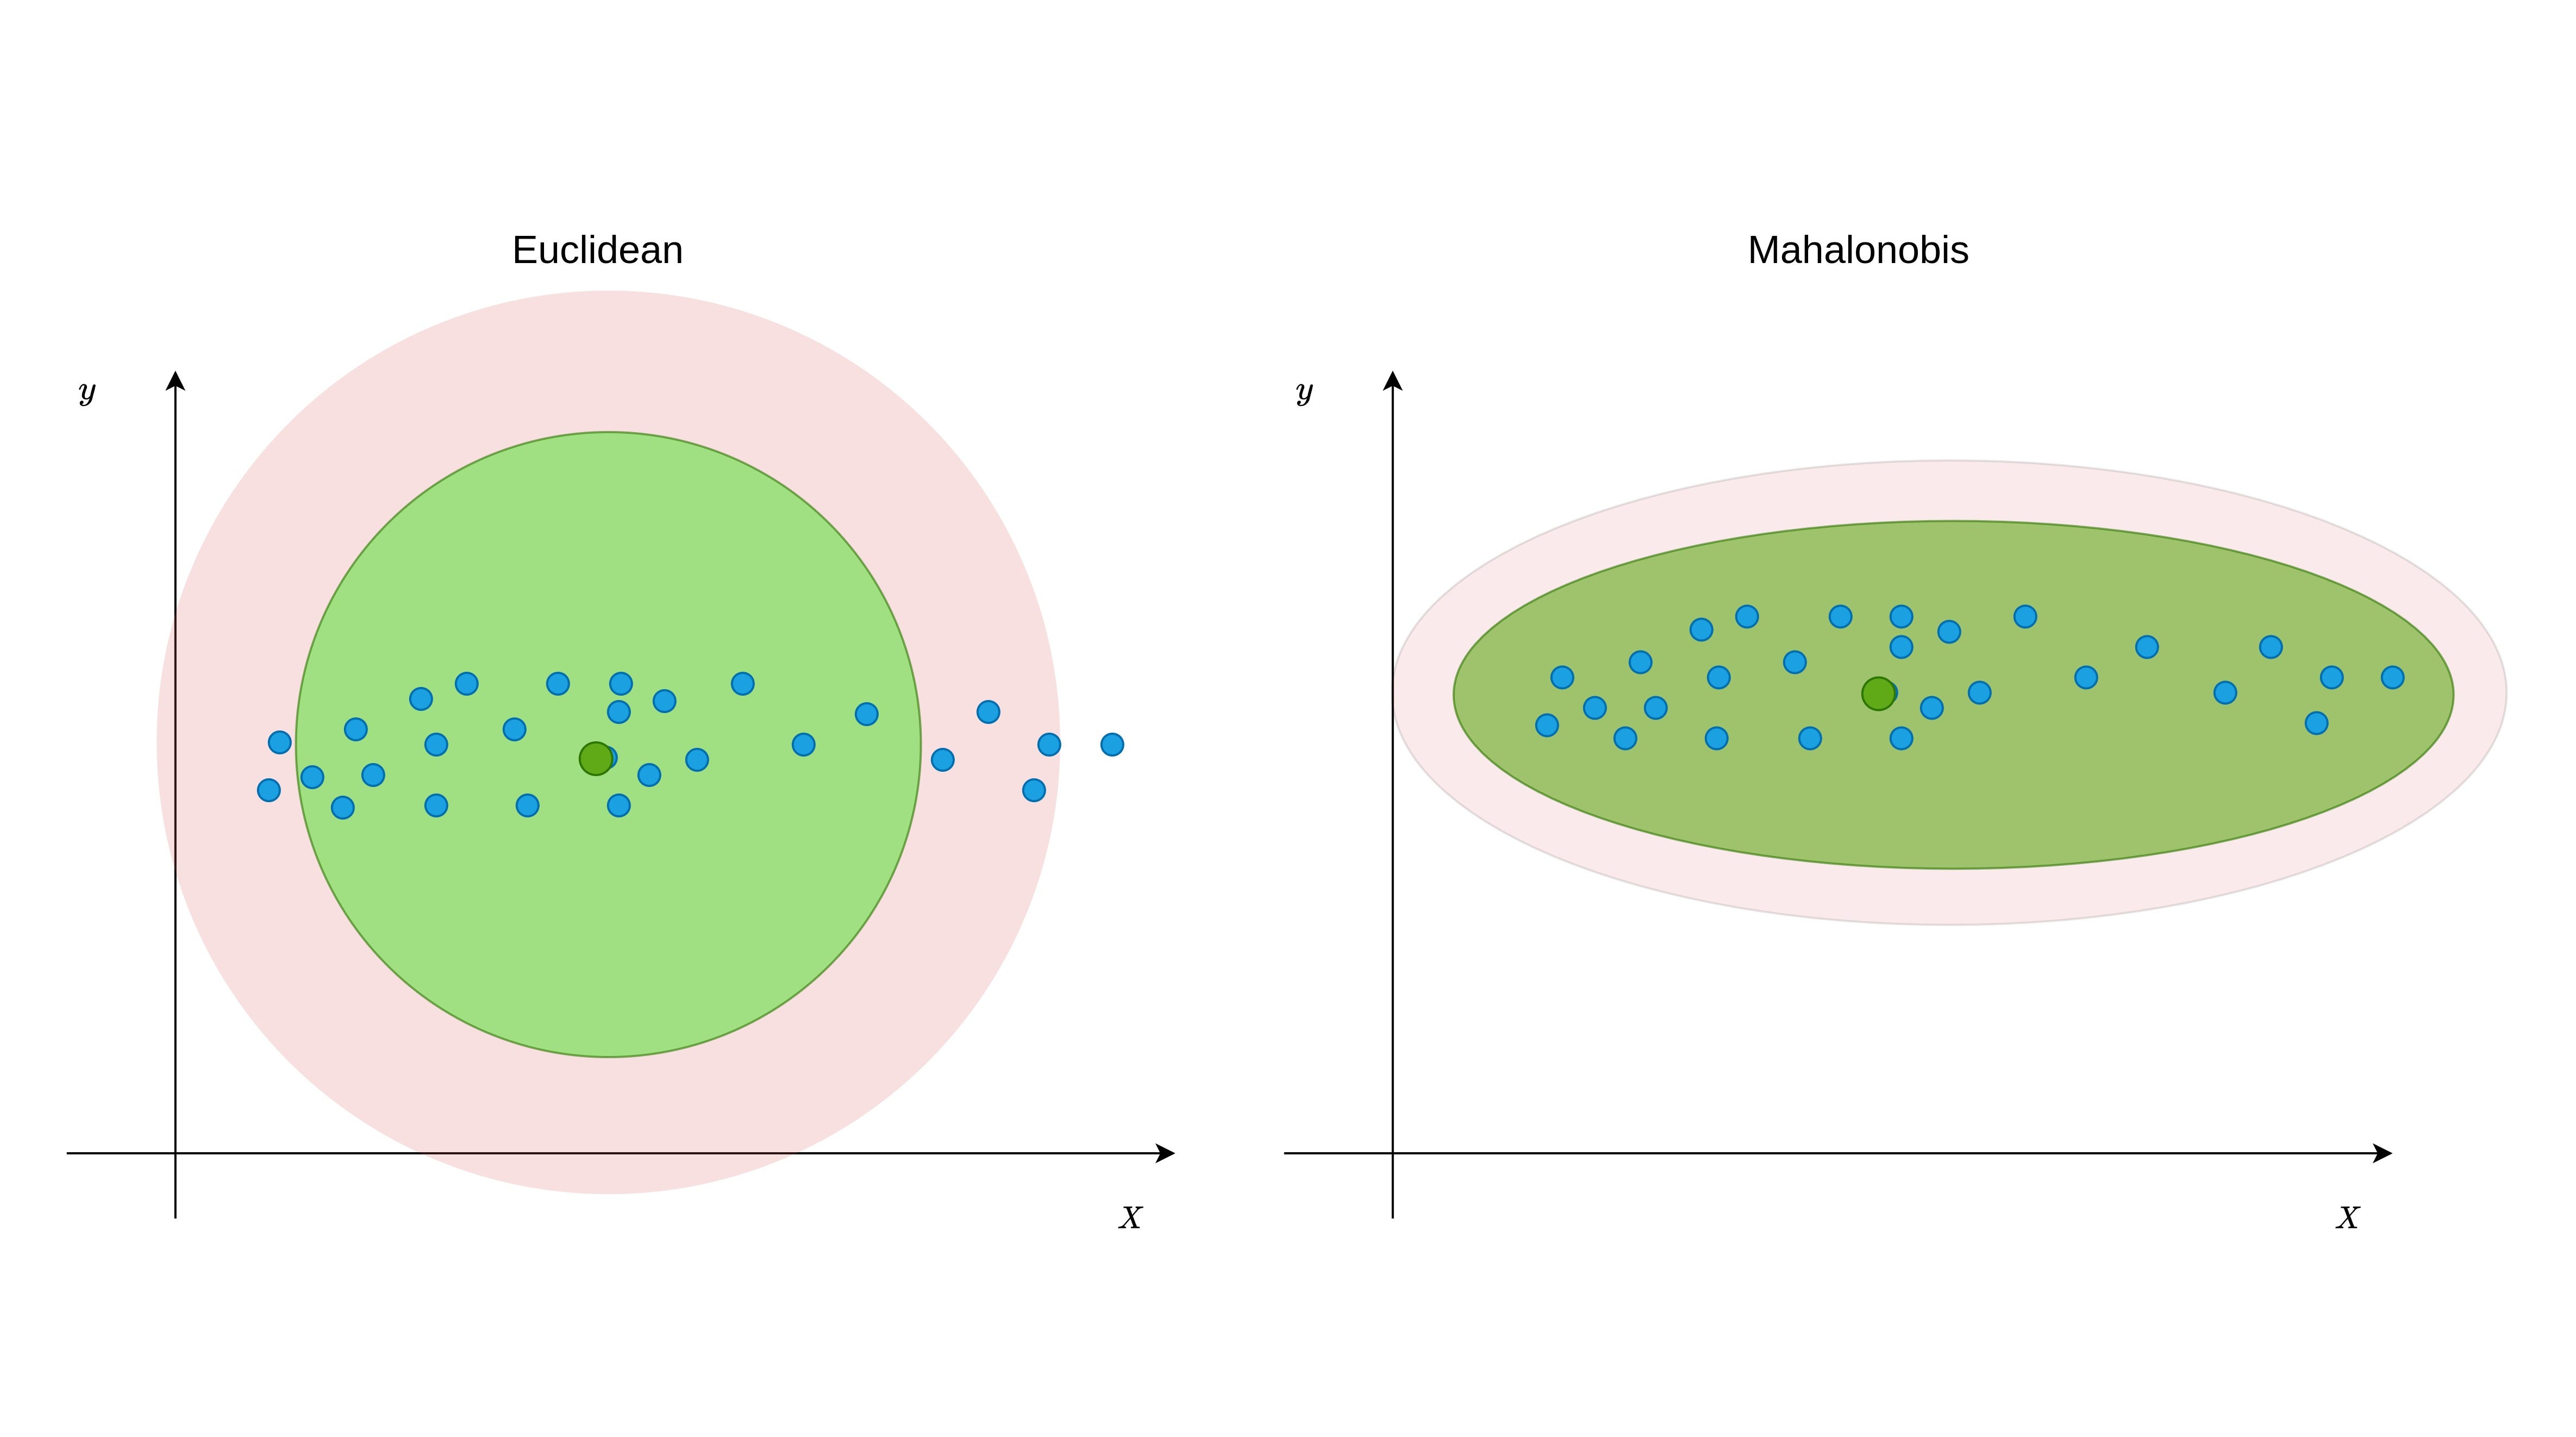
Mahalanobis Distance (MD) is an effective distance metric that finds the distance between the point and distribution (see also). It works quite effectively on multivariate data because it uses a covariance matrix of variables to find the distance between data points and the center (see Formula 1). This means that MD detects outliers based on the distribution pattern of data points, unlike the Euclidean distance. Please see Figure 1 to understand the difference.

As can be seen from Figure 1, data points are scattered in a certain direction. While Euclidean distance can assign some non-outlier points as outliers in such distributions, Mahalanobis distance can keep up with it. This is also the same for the non-linear relations as seen from Figure-2.
The main reason for this difference is the covariance matrix because covariance indicates how variables variate together. Using covariance while calculating distance between center and points in n-dimensional space provides finding true threshold border based on the variation. As can be seen from the distance formula of MD shown in Formula 1, the covariance matrix had presented as C and the negative first power of it had taken. The vectors Xpi represent coordinates of observations in n-dimensional space. For example, suppose there is a data-set with three variables, its first row, and the second row can be represented like this: Xp1:[13,15,23] and Xp2:[12,14,15] . However, while identifying outliers, the distance between the center and each observation should be found instead of finding the distance between each point. The center point can be obtained by taking the average value of each variable.

Note: Unlike the example data, given in Figures 1 and 2, when the variables are mostly scattered in a circle, the euclidean distance may be a more suitable option.
Mahalanobis Distance with Python
Yes, it’s time to find the Mahalanobis distance using Python. If you are interested in R instead of Python, you can take a look at my other article.
There is a method for Mahalanobis Distance in the ‘Scipy’ library. You can access this method from scipy.spatial.distance.mahalanobis. You can also see its details here. Instead of using this method, in the following steps, we will be creating our own method to calculate Mahalanobis Distance by using the formula given at the Formula 1.
I will be using the data-set called “airquality” and detect outliers only using variables “Ozone” and “Temp”. Either, you can download this data set from here or use your data-set.
First, we should import the necessary libraries and the data-set. To make the data-set ready for the calculations, only the variables “Ozone” and “Temp” should be selected. Plus, not to face any error NA values should be dropped if there is any. Also, I prefer to use the NumPy array instead of using pandas data frame. That’s why I converted it to a NumPy array.
For the second step, we need to obtain the necessary values to calculate the distance between center and point. So, these are the center point and covariance matrix between the “Ozone” and “Temp” variables.
For the third step, we are ready to find the distance between the center point and each observation (point) in the data-set. We also need to find a cutoff value from the Chi-Square distribution. The reason why Chi-Square is used to find cutoff value is, Mahalanobis Distance returns the distance as squared (D² ). We should also take the quantile value as 0.95 while finding cutoff because the points outside the 0.95 (two-tailed) will be considered as an outlier. Less quantile means less cutoff value. We also need a degree of freedom value for Chi-Square, and it is equal to the number of variables in our data-set, so 2.
Finally, we have four outliers at the index of [24, 35, 67, 81]. Now, let’s make and plot to understand this process more clearly.
And here we go, as you can see from Figure 3, the points stay outside the ellipse detected as an outlier. This ellipse represents the area that wraps non-outlier values according to MD.

What is Next?
In this article, Mahalanobis Distance and its difference from Euclidean distance has discussed. We also have applied the Mahalanobis Distance formula on Python from scratch. As it’s mentioned before, it is important to choose a distance metric based on how data scattered in n-dimensional space. You can also have a look at the other distance metric called Cook Distance.
If you have any questions please feel free to leave a comment.
You can check my other article if you are interested in how to detect outliers by using Mahalanobis Distance in R.
Interoperable Python and SQL in Jupyter Notebooks
Interoperable Python and SQL in Jupyter Notebooks
Using SQL on top of Pandas, Spark, and Dask
Note: Most of the code snippets are images because that was the only way to preserve SQL syntax highlighting. For an interactive code example, check out this Kaggle notebook.
Motivation
The goal of FugueSQL is to provide an enhanced SQL interface (and experience) for data professionals to perform end-to-end data compute workflows in a SQL-like language. With FugueSQL, SQL users can perform full Extract, Transform, Load (ETL) workflows on DataFrames inside Python code and Jupyter notebooks. The SQL is parsed and mapped to the corresponding Pandas, Spark, or Dask code.
This empowers heavy SQL users to harness the power of Spark and Dask, while using their language of choice to express logic. Additionally, distributed compute keywords have been added such as PREPARTITIONandPERSIST, in order to extend the capabilities beyond standard SQL.
In this article we’ll go over the basic FugueSQL features, and how to use it on top of Spark or Dask by specifying the execution engine.
Enhancements Over ANSI SQL
The first changes as seen in the GIF above are the LOADand SAVE keywords. Beyond these, there are some other enhancements that provide a friendlier syntax. Users can also use Python functions inside FugueSQL, creating a powerful combination.
FugueSQL users can have SQL cells in notebooks (more examples later) by using the %%fsqlcell magic. This also provides syntax highlighting in Jupyter notebooks. Although not demonstrated here, these SQL cells can be used in Python code with thefsql() function.
Variable Assignment
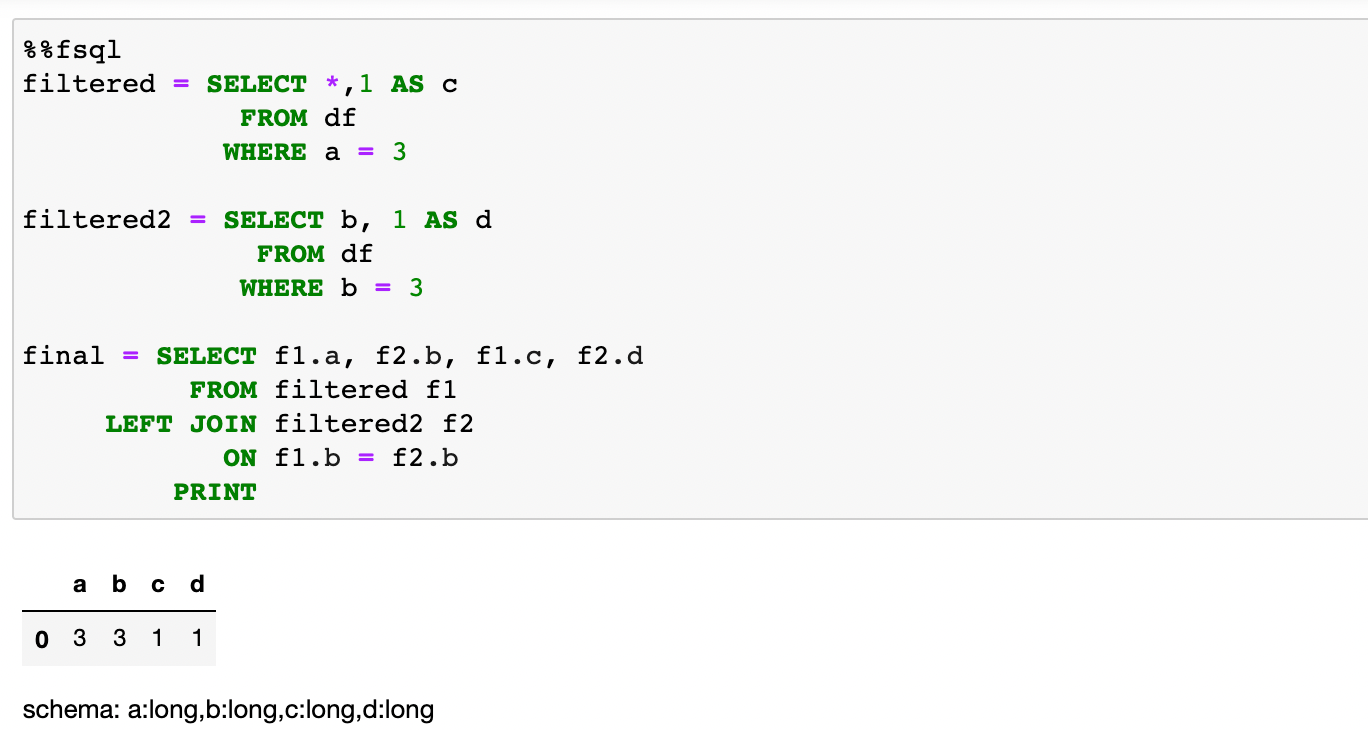
DataFrames can be assigned to variables. This is similar to SQL temp tables or Common Table Expressions (CTE). Although not shows in this tutorial, these DataFrames can also be brought out of the SQL cells and used in Python cells. The example below shows two new DataFrames that came from modifying df . dfwas created by using Pandas in a Python cell (this is the same df as the first image). The two new DataFrames are joined together to create a DataFrame namedfinal.
Jinja Templating
FugueSQL can interact with Python variables through Jinja templating. This allows Python logic to alter SQL queries similar to parameters in SQL.
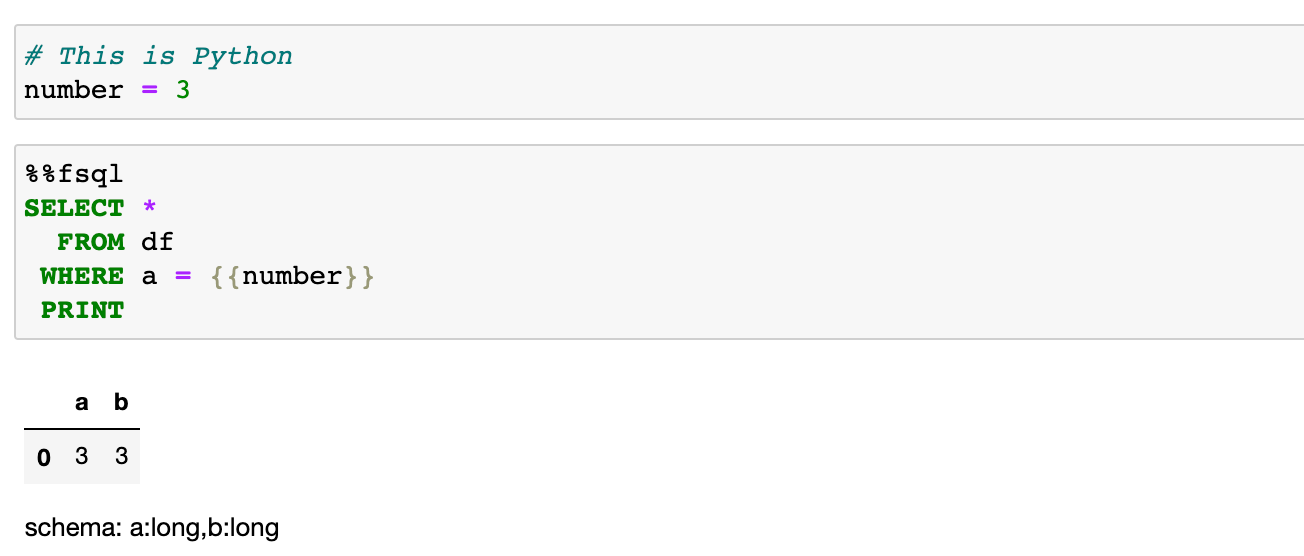
Python Functions
FugueSQL also supports using Python functions inside SQL code blocks. In the example below, we use seaborn to plot two columns of our DataFrame. We invoke the function using the OUTPUT keyword in SQL.

Comparison to ipython-sql

FugueSQL is meant to operate on data that is already loaded into memory (although there are ways to use FugueSQL to bring in data from storage). There is a project called ipython-sql that provides the %%sql cell magic command. This command is meant to use SQL to load data into the Python environment from a database.
FugueSQL’s guarantee is that the same SQL code will work on Pandas, Spark, and Dask without any code change. The focus of FugueSQL is in-memory computation, as opposed to loading data from a database.
Distributed Compute with Spark and Dask
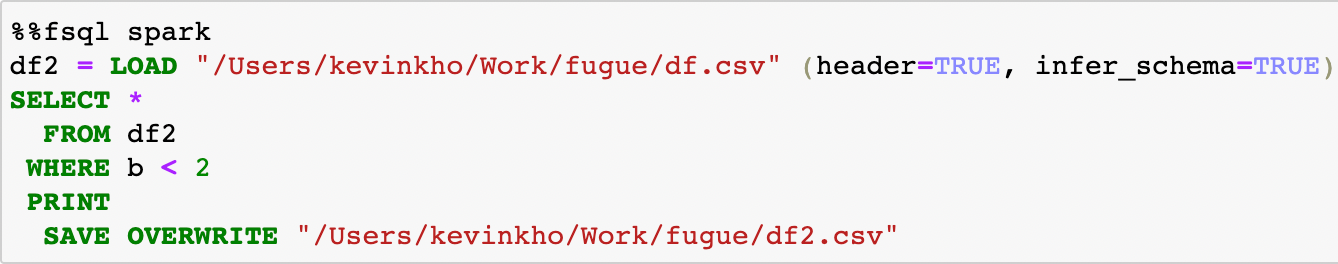
As the volume of data we work with continues to increase, distributed compute engines such as Spark and Dask are becoming more widely adopted by data teams. FugueSQL allows users to use these more performant engines the same FugueSQL code.
In the code snippet below, we just changed the cell magic from %%fsql to %%fsql spark and now the SQL code will run on the Spark execution engine. Similarly, %%fsql dask will run the SQL code on the Dask execution engine.
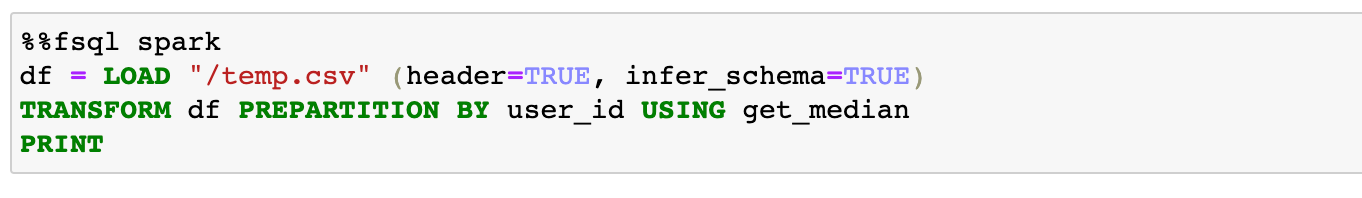
One of the common operations that can benefit from moving to a distributed compute environment is getting the median of each group. In this example, we’ll show the PREPARTITIONkeyword and how to apply a function on each partition of data.
First, we define a Python function that takes in a DataFrame and outputs the user_id and the median measurement. This function is meant to operate on only one user_id at a time. Even if the function is defined in Pandas, it will work on Spark and Dask.
We can then use the PREPARTITION keyword to partition our data by the user_id and apply the get_median function.
In this example, we get the median measurement of each user. As the data size gets larger, more benefits will be seen from the parallelization. In an example notebook we have, the Pandas engine took around 520 seconds for this operation. Using the Spark engine (parallelized on 4 cores) took around 70 seconds for a dataset with 320 million rows.
The difference in execution time is expected. What FugueSQL allows SQL users to do is extend their workflows to Spark and Dask when the data becomes too big for Pandas to effectively handle.
Another common use-case is Dask handles memory spillover and writing data to the disk. This means users can process more data before hitting out-of-memory issues.
Conclusion and More Examples
In this article, we explored the basics features of FugueSQL that allow users to work on top of Pandas, Spark, and Dask DataFrames through SQL cells in Jupyter notebook.
Fugue decouples logic and execution, making it easy for users to specify the execution engine during runtime. This empowers heavy SQL users by allowing them to express their logic indepedent of a compute framework. They can easily migrate workflows to Spark or Dask when the situation calls for it.
There are a lot of details and features that can’t be covered in one blog post. For an end-to-end example, visit the Kaggle notebook that we prepared for Thinkful data analyst bootcamp students.
Setup in Notebooks
Fugue (and FugueSQL) are available through PyPI. They can be installed using pip (installation of Dask and Spark are separate).
pip install fugue
Inside a notebook, the FugueSQL cell magic %%fsql can be used after running the setup function. This also provides syntax highlighting for SQL commands.
from fugue_notebook import setup
setup()
Contact Us
If you’re interested in using FugueSQL, want to give us feedback, or have any questions, we’d be happy to chat on Slack! We are also giving workshops to data teams interested in applying FugueSQL (or Fugue) in their data workflows.
FugueSQL is just one part of the broader Fugue ecosystem. Fugue is an abstraction layer that allows users to write code in native Python, and then execute the code on Pandas, Spark, or Dask without code changes during runtime. More information can be found in the repo above.