
Multivariate Outlier Detection in Python
Multivariate Outliers and Mahalanobis Distance in Python
Detecting outliers in multivariate data can often be one of the challenges of the data preprocessing phase. There are various distance metrics, scores, and techniques to detect outliers. Euclidean distance is one of the most known distance metrics to identify outliers based on their distance to the center point. There is also a Z-Score to define outliers for a single numeric variable. In some cases, clustering algorithms can be also preferred. All these methods consider outliers from different perspectives. The outliers are found based on one method may not be found by the others as outliers. Therefore, these methods and metrics should be chosen by considering the distribution of the variables. However, this brings out the needs of different metrics too. In this article, we will be discussing the distance metric called Mahalanobis Distance for detecting outliers in multivariable data.
Mahalonobis Distance
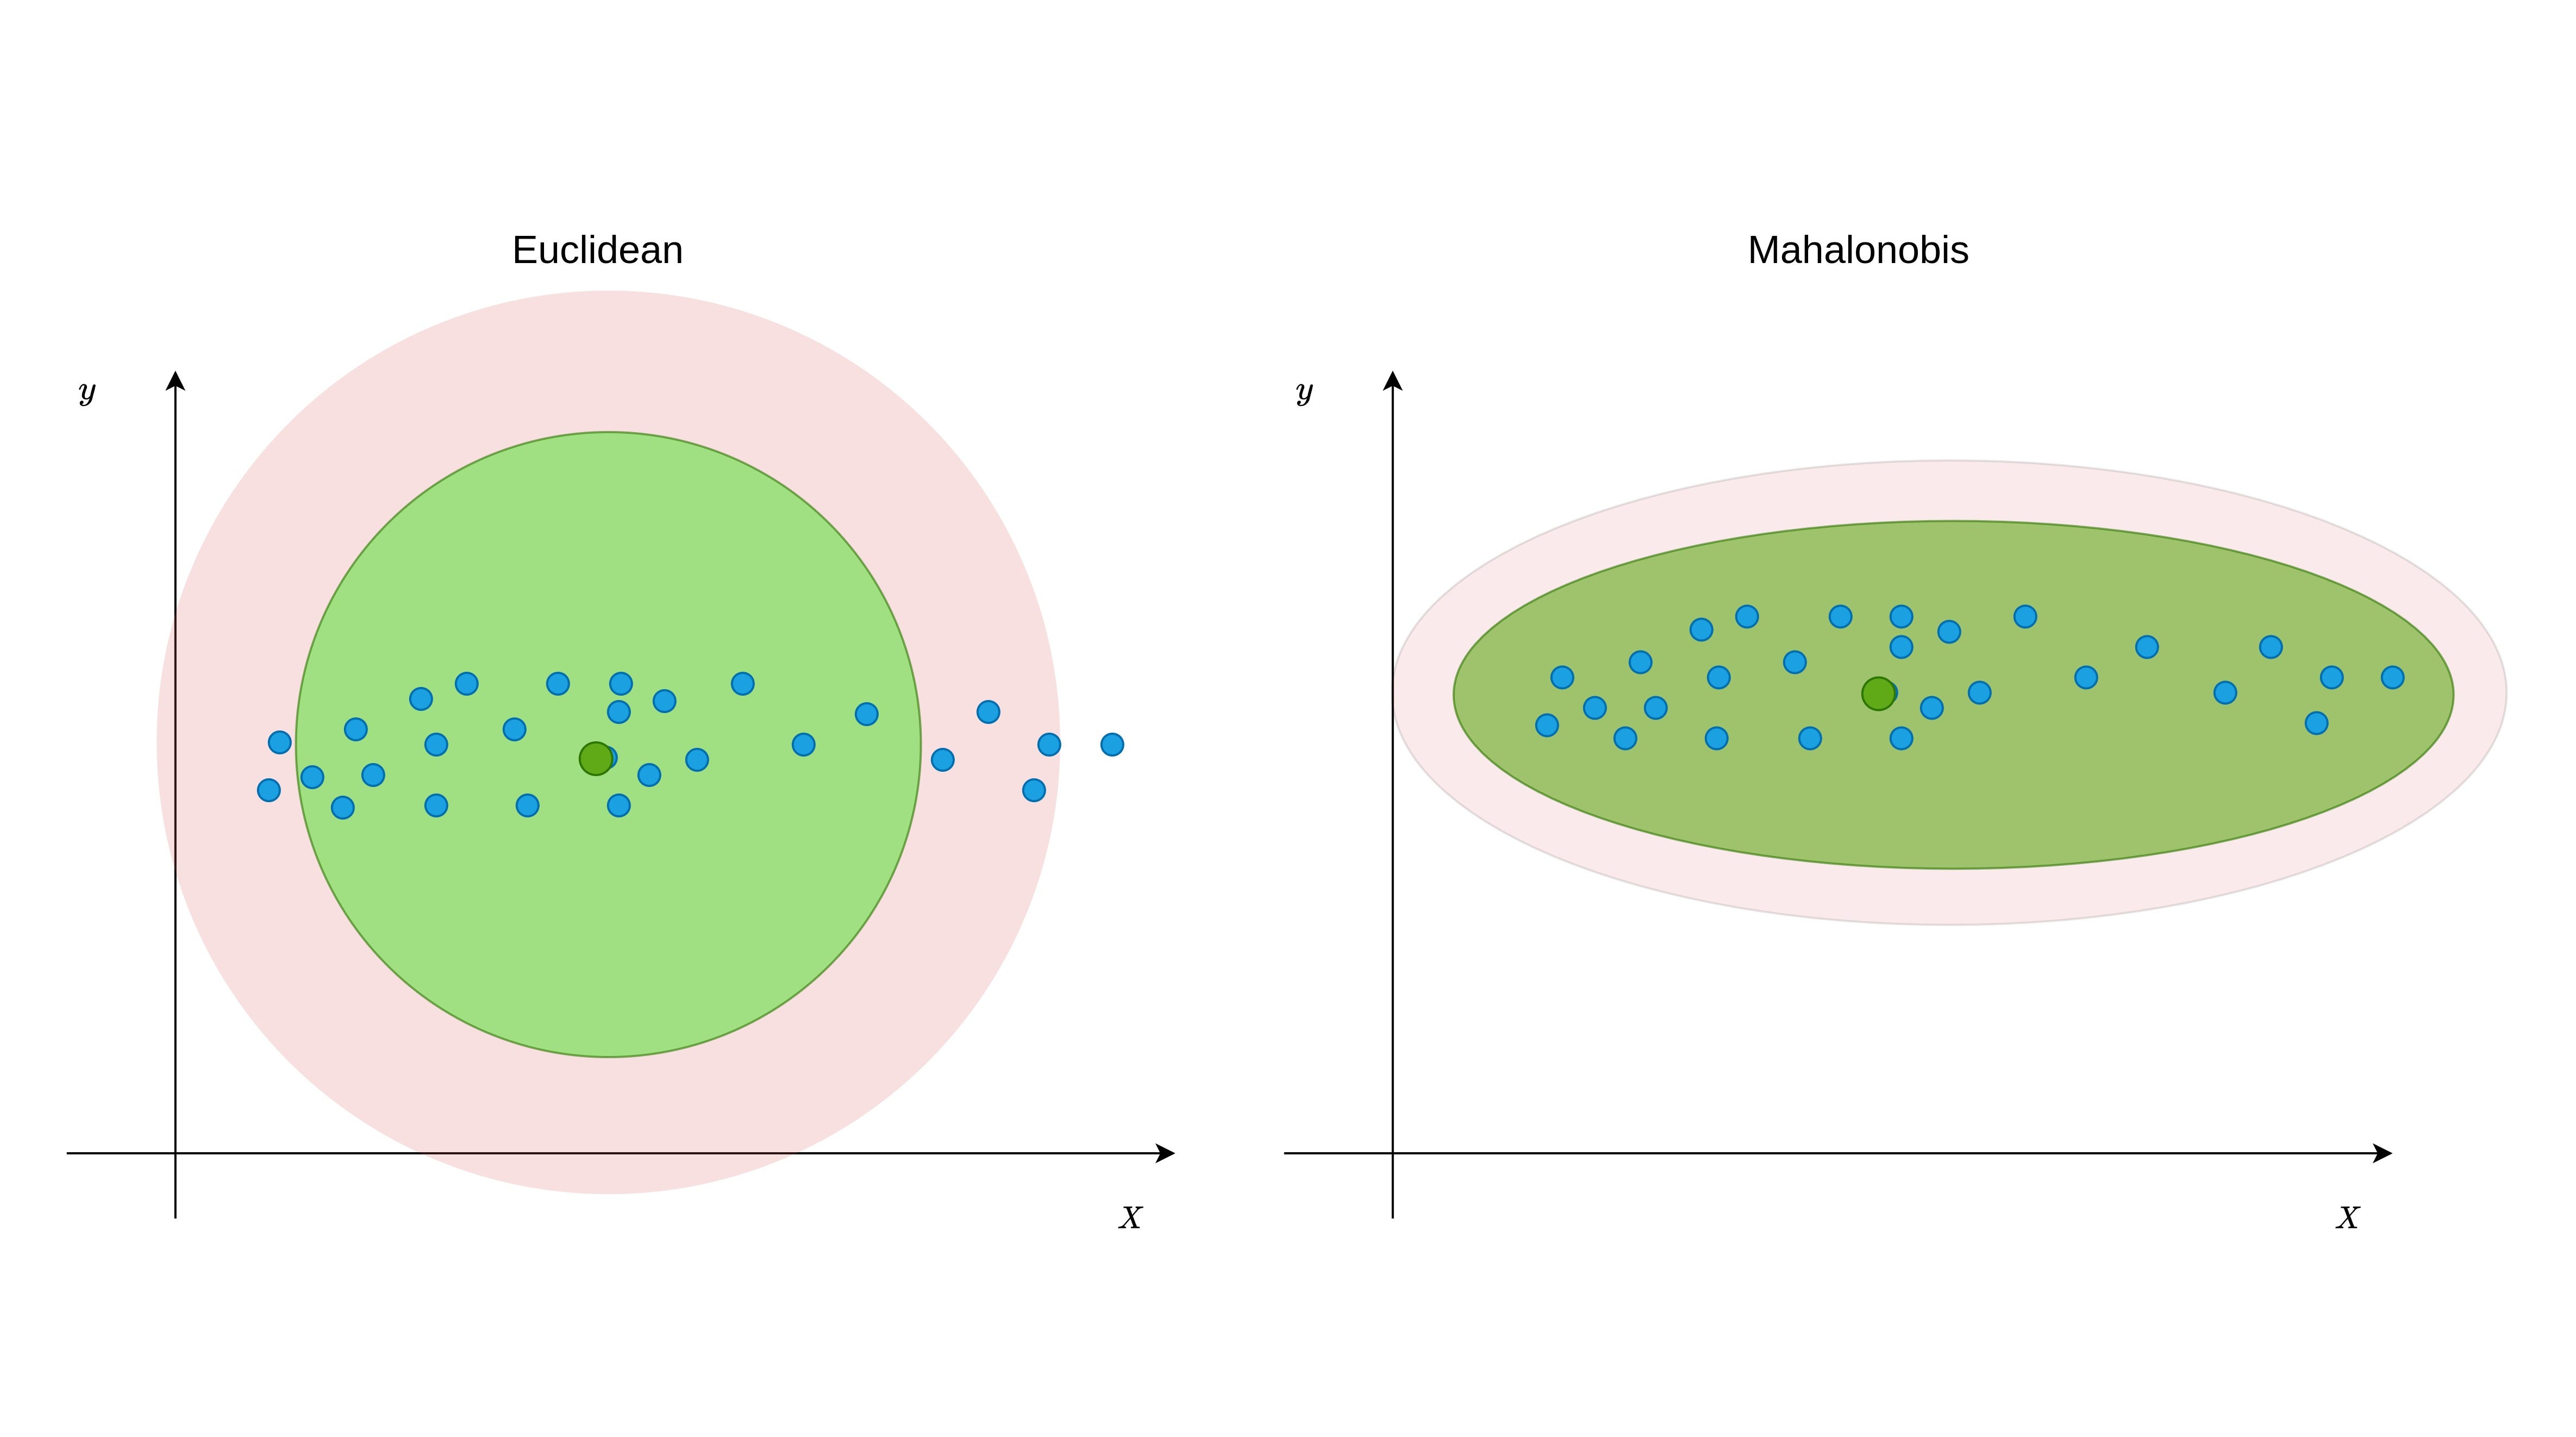
Mahalanobis Distance (MD) is an effective distance metric that finds the distance between the point and distribution (see also). It works quite effectively on multivariate data because it uses a covariance matrix of variables to find the distance between data points and the center (see Formula 1). This means that MD detects outliers based on the distribution pattern of data points, unlike the Euclidean distance. Please see Figure 1 to understand the difference.

As can be seen from Figure 1, data points are scattered in a certain direction. While Euclidean distance can assign some non-outlier points as outliers in such distributions, Mahalanobis distance can keep up with it. This is also the same for the non-linear relations as seen from Figure-2.
The main reason for this difference is the covariance matrix because covariance indicates how variables variate together. Using covariance while calculating distance between center and points in n-dimensional space provides finding true threshold border based on the variation. As can be seen from the distance formula of MD shown in Formula 1, the covariance matrix had presented as C and the negative first power of it had taken. The vectors Xpi represent coordinates of observations in n-dimensional space. For example, suppose there is a data-set with three variables, its first row, and the second row can be represented like this: Xp1:[13,15,23] and Xp2:[12,14,15] . However, while identifying outliers, the distance between the center and each observation should be found instead of finding the distance between each point. The center point can be obtained by taking the average value of each variable.

Note: Unlike the example data, given in Figures 1 and 2, when the variables are mostly scattered in a circle, the euclidean distance may be a more suitable option.
Mahalanobis Distance with Python
Yes, it’s time to find the Mahalanobis distance using Python. If you are interested in R instead of Python, you can take a look at my other article.
There is a method for Mahalanobis Distance in the ‘Scipy’ library. You can access this method from scipy.spatial.distance.mahalanobis. You can also see its details here. Instead of using this method, in the following steps, we will be creating our own method to calculate Mahalanobis Distance by using the formula given at the Formula 1.
I will be using the data-set called “airquality” and detect outliers only using variables “Ozone” and “Temp”. Either, you can download this data set from here or use your data-set.
First, we should import the necessary libraries and the data-set. To make the data-set ready for the calculations, only the variables “Ozone” and “Temp” should be selected. Plus, not to face any error NA values should be dropped if there is any. Also, I prefer to use the NumPy array instead of using pandas data frame. That’s why I converted it to a NumPy array.
For the second step, we need to obtain the necessary values to calculate the distance between center and point. So, these are the center point and covariance matrix between the “Ozone” and “Temp” variables.
For the third step, we are ready to find the distance between the center point and each observation (point) in the data-set. We also need to find a cutoff value from the Chi-Square distribution. The reason why Chi-Square is used to find cutoff value is, Mahalanobis Distance returns the distance as squared (D² ). We should also take the quantile value as 0.95 while finding cutoff because the points outside the 0.95 (two-tailed) will be considered as an outlier. Less quantile means less cutoff value. We also need a degree of freedom value for Chi-Square, and it is equal to the number of variables in our data-set, so 2.
Finally, we have four outliers at the index of [24, 35, 67, 81]. Now, let’s make and plot to understand this process more clearly.
And here we go, as you can see from Figure 3, the points stay outside the ellipse detected as an outlier. This ellipse represents the area that wraps non-outlier values according to MD.

What is Next?
In this article, Mahalanobis Distance and its difference from Euclidean distance has discussed. We also have applied the Mahalanobis Distance formula on Python from scratch. As it’s mentioned before, it is important to choose a distance metric based on how data scattered in n-dimensional space. You can also have a look at the other distance metric called Cook Distance.
If you have any questions please feel free to leave a comment.
You can check my other article if you are interested in how to detect outliers by using Mahalanobis Distance in R.