
Mapping Black-Owned Businesses with GeoPy and Folium
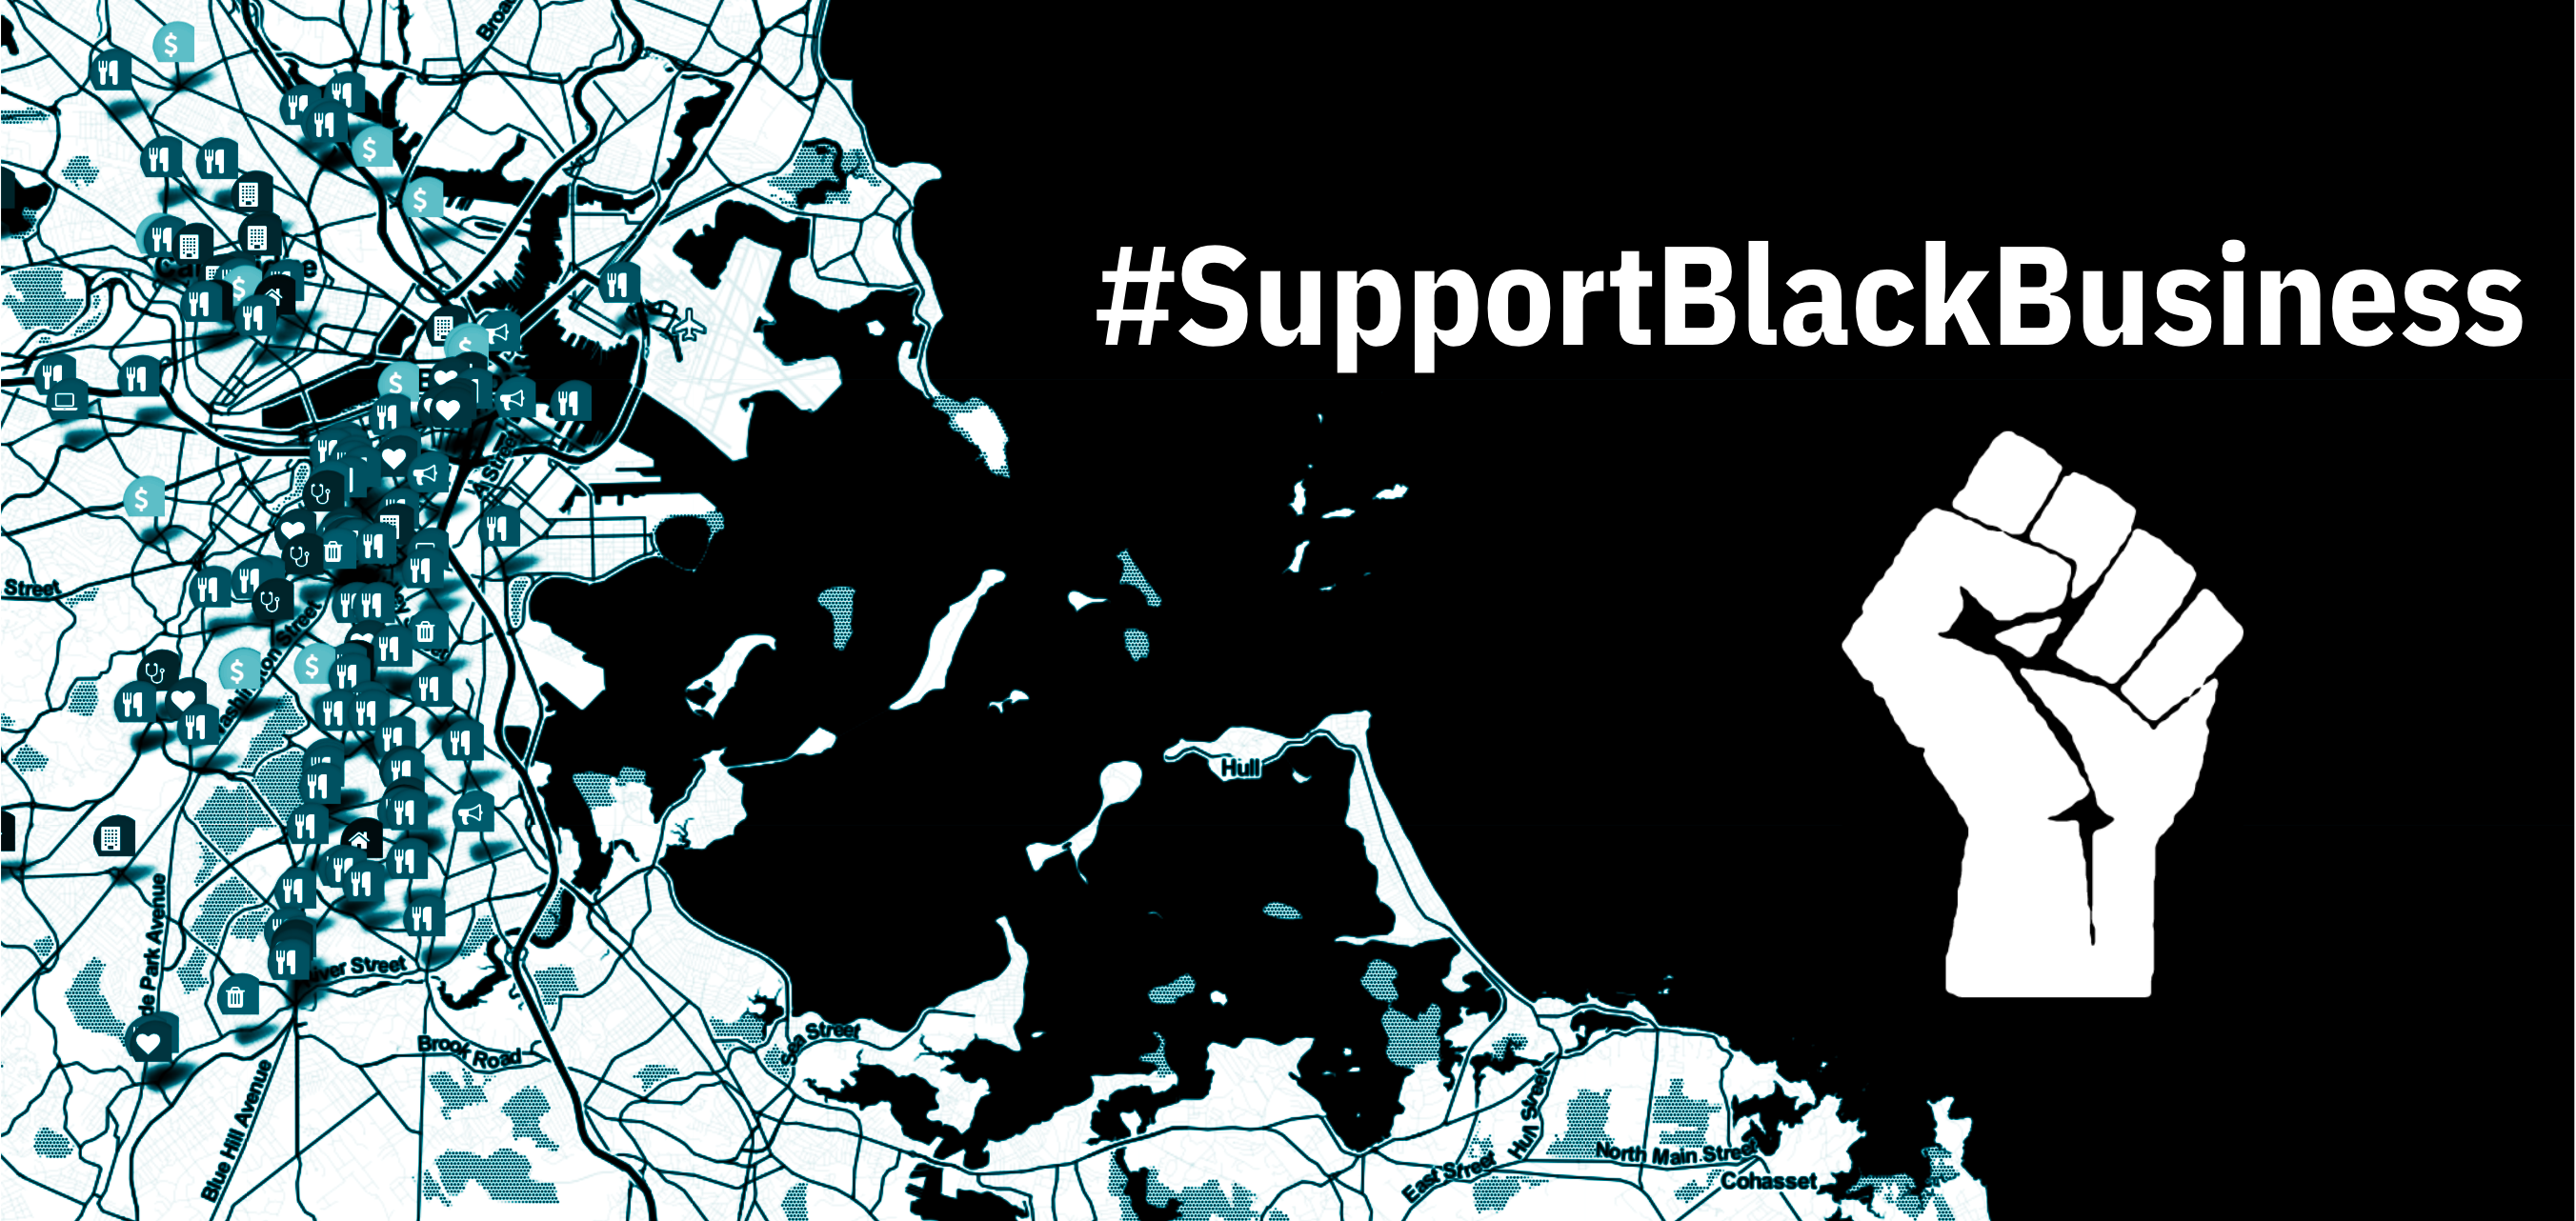
A public, interactive map to explore Black-owned businesses in the Greater Boston Area
Introduction
The COVID-19 pandemic has taken a serious toll on small businesses across the United States, and Black-owned businesses continue to be hit the hardest. In the past year, many have watched the escalation of ongoing economic and racial justice crises compound with a crisis of public health. Calls to support local and Black-owned businesses can hardly begin to accomplish all that’s needed to put an end to these concurrent crises; such calls can, however, be a small step in the right direction toward narrowing the racial wealth gap and repairing local economies.
The map discussed in this article is intended to be a resource for people interested in exploring Black-owned businesses to support in the Greater Boston area, and for those who wish to create similar maps for other regions. The map uses data from this crowd-sourced spreadsheet of Black-owned stores, restaurants and services in the Boston area. It should be noted that not every entry in the spreadsheet has been confirmed to be a Black-owned business, so the map may include both confirmed and unconfirmed entries.
Cleaning the Data
The data from the above spreadsheet document was read into three separate pandas data frames: ‘restaurant,’ ‘store,’ and ‘service.’ The columns of the data frames were renamed where necessary such that each one contained a ‘Name,’ ‘Address,’ and ‘Website’ column. The final service data frame also contained a ‘Category’ column, which allowed for simple subsetting by service category in the mapping stage.
Duplicate names were removed, so that one marker could be added to the map for each business. Many multi-service businesses had duplicate appearances in the service data frame. Only the first occurrence of each business was kept, which means that one limitation of the map is that its markers may not capture the variety of services offered by some businesses.
In the case of the restaurant and service data frames, address data was originally spread across multiple columns. Components of each address were concatenated into a single column with with the Series.str.cat() method, as in this example:
Obtaining the Geographic Coordinates
Once a full address column was ready for each data frame, geographic coordinates were obtained with GeoPy. The GeoPy client allows developers to retrieve coordinates given an address, and vice versa. The below function obtains coordinates for an entire column of addresses by iterating through the column and appending the latitude and longitude to ‘lat’ and ‘lon’ lists. The client returned NoneType objects for certain addresses that it could not obtain coordinate data for. To account for these cases, the if/else statement in the function makes it so that coordinate data is obtained only for a geopy.location.location object; for NoneType objects, “NA” is appended to the list.
Adding Markers to the Map
The above function was used as a helper function in add_markers(), which adds markers to a map in Folium. The location parameter in folium.map() takes a set of geographic coordinates, which marks the default center location of the map. The tiles parameter affects the style of the map’s background, and the zoom_start parameter refers to the maps’s initial zoom level, where higher numbers create a closer zoom.
The add_markers() function takes a data frame with an ‘Address’ column, a marker color, and a marker icon as arguments. It retrieves the coordinate data for the addresses with get_lat_lon() and filters out rows with missing coordinate data. The points to be added to the map, and their corresponding business information, are stored into a list of zip objects. Each object, aliased as ‘p’ in the for loop, contains the following data:
- p[0] and p[1]: latitude and longitude, respectively
- p[2]: Business name
- p[3]: Business address
- p[4]: Business website
The final element in the zip object for each business, website, may contain null data if a website was not recorded in the spreadsheet. The if/else statement in the function adds only the business name and address to the marker’s popup text in these cases; if a website is available, it will also be included in the popup text.
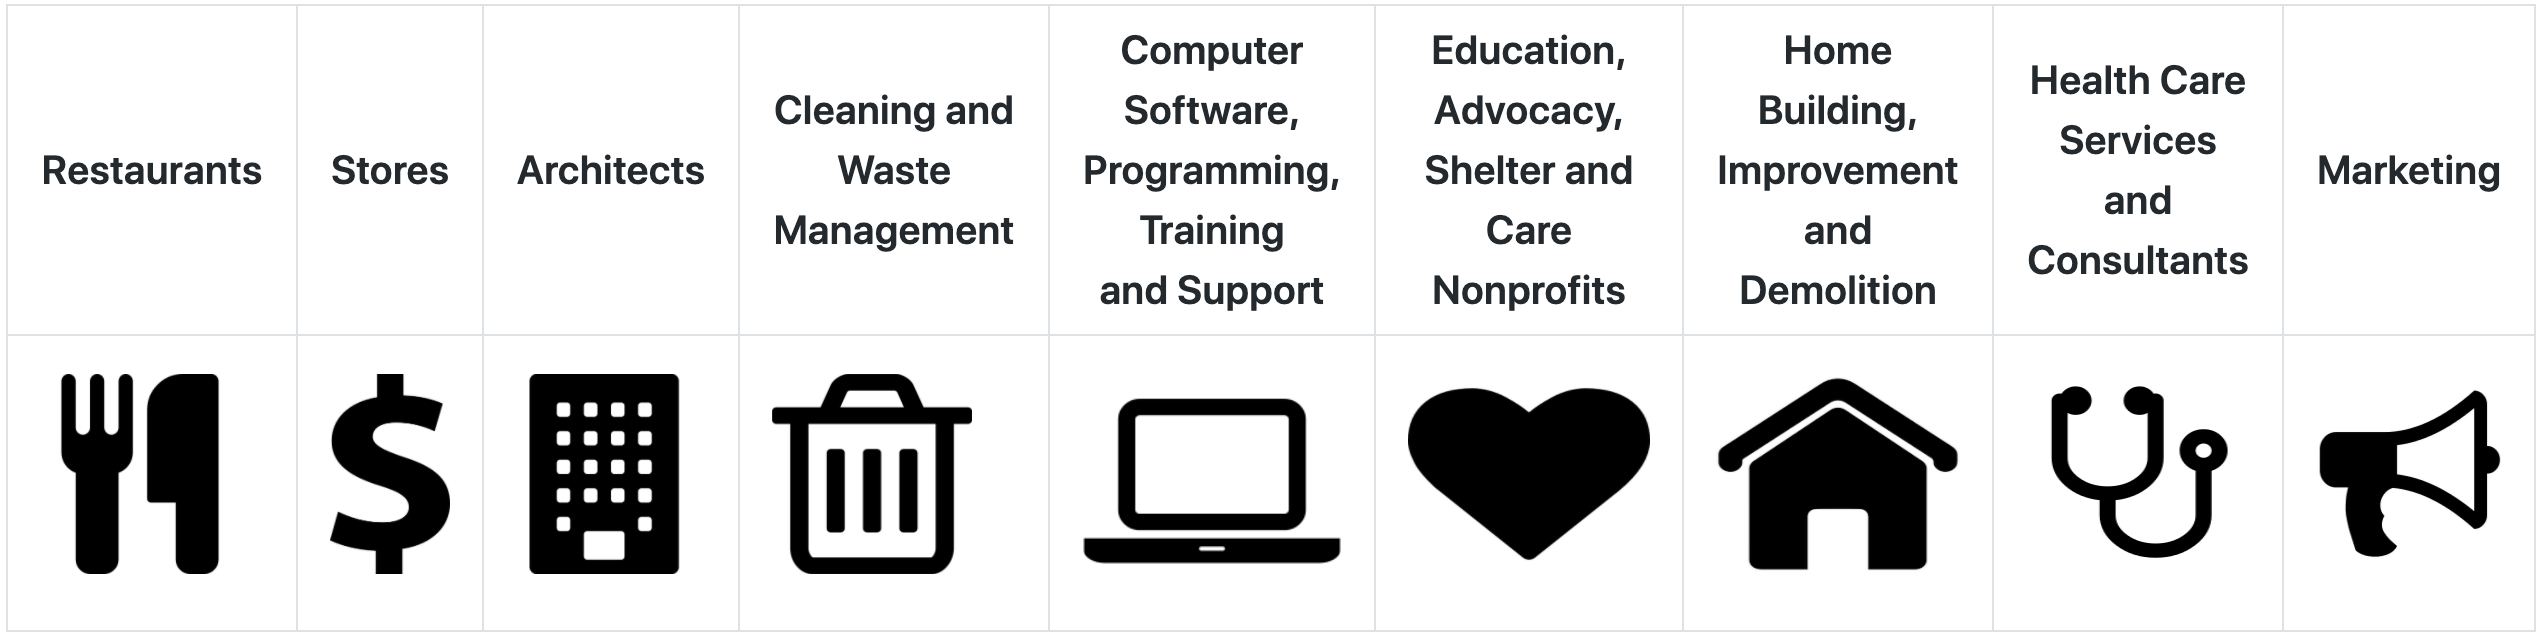
In this function, the icon argument takes the same size dimensions for all markers. The markers’ color and icon will vary based on what gets passed into the add_markers() function. Icons used in the map were accessed via Font Awesome, whose prefix keyword argument is ‘fa’ in the icon argument. The below table shows different types of markers that have already been added to the map and the business categories they correspond to:
The add_markers() function was used on the restaurant and store data frames, and on subsets of the service data frame that were broken up by category. In the example below, rows that correspond to architectural services went into the ‘architects’ data frame. The function was then called on the data frame, and the markers were given a cadet blue ‘building’ icon:
Exploring the Map
Here is a preview of what the map currently looks like and how it can be navigated:
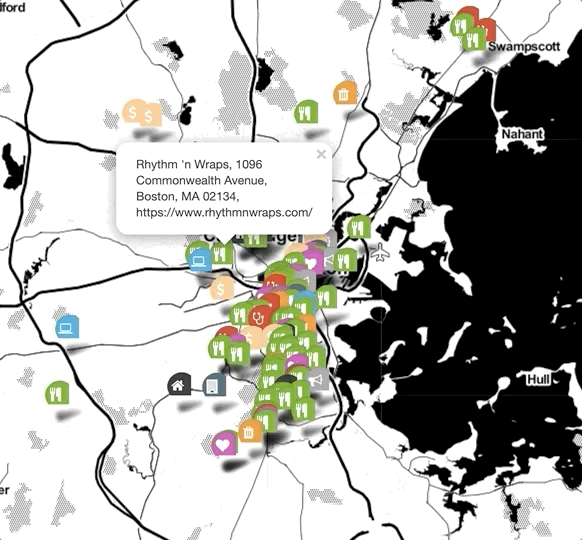
The interactive map is hosted here. Feel free to explore it by zooming into a neighborhood of your choice and clicking on business markers to view their popup information.
Conclusion
This article reviewed my process for creating an interactive map of Black-owned businesses in the Boston area. To see the full code for this project, visit its GitHub repository.
You should also follow Backing Black Business, whose contributors plan to display Black-owned businesses across the United States on an interactive map. There is an option on the current website for Black business owners to submit information about their business for inclusion on the map once it’s launched.
Supporting Black-owned businesses goes beyond creating lists and maps for easy discovery. Resources like these only have real value if they are actually used to find Black-owned businesses to support with your dollar—both in these especially difficult economic times and beyond.