
4 Tips to Make the Most of Pandas Groupby Function
Boost your exploratory data analysis process

Pandas is a highly popular data analysis and manipulation library. It provides numerous functions to perform efficient data analysis. Furthermore, its syntax is simple and easy-to-understand.
In this article, we focus on a particular function of Pandas, the groupby. It is used to group the data points (i.e. rows) based on the categories or distinct values in a column. We can then calculate a statistic or apply a function on a numerical column with regards to the grouped categories.
The process will be clear as we go through the examples. Let’s start by importing the libraries.
import numpy as np
import pandas as pd
We also need a dataset for the examples. We will use a small sample from the Melbourne housing dataset available on Kaggle.
df = pd.read_csv("/content/melb_data.csv", usecols = ['Price','Landsize','Distance','Type', 'Regionname'])df = df[(df.Price < 3_000_000) & (df.Landsize < 1200)].sample(n=1000).reset_index(drop=True)df.head()
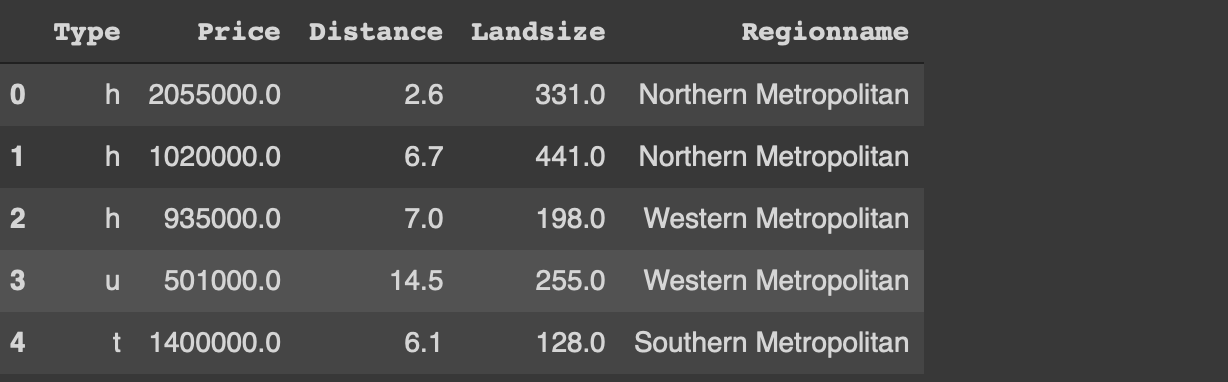
I have only read a small part of the original dataset. The usecols parameter of the read_csv function allows for reading only the given columns of the csv file. I have also filtered out the outliers with regards to the price and land size. Finally, a random sample of 1000 observations (i.e. rows) is selected using the sample function.
Before starting on the tips, let’s implement a simple groupby function to perform average distance for each category in the type column.
df[['Type','Distance']].groupby('Type').mean()
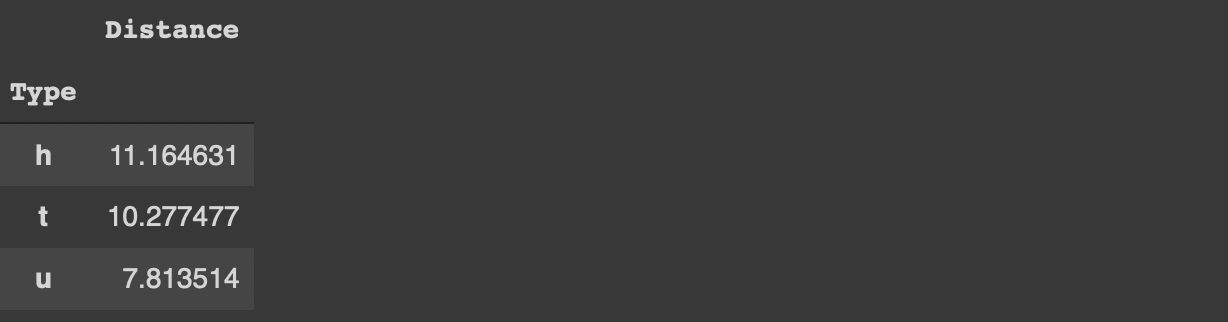
The houses (h) are further away from the central business district than the other two types on average.
We can now start with the tips to use the groupby function more effectively.
1. Customize the column names
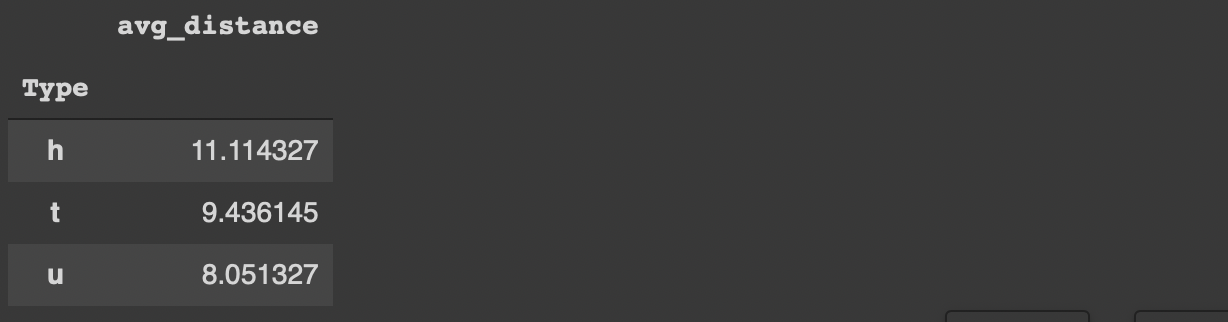
The groupby function does not change or customize the column names so we do not really know what the aggregated values represent. For instance, in the previous example, it would be more informative to change the column name from “distance” to “avg_distance”.
One way to accomplish this is to use the agg function instead of the mean function.
df[['Type','Distance']].groupby('Type').agg(
   avg_distance = ('Distance', 'mean')
)
We can always change the column name afterwards but this method is more practical.
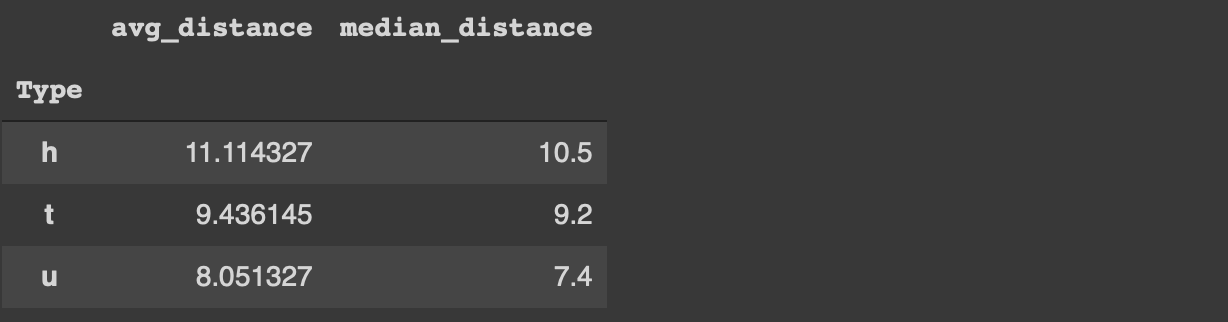
Customizing the column names becomes more important if we aggregate multiple columns or apply different functions to one column. The agg function accepts multiple aggregations. We just need to specify the column name and the function.
For instance, we can calculate the average and median distance values for each category in the type column as below.
df[['Type','Distance']].groupby('Type').agg(
  avg_distance = ('Distance', 'mean'),
  median_distance = ('Distance', 'median')
)
2. Lambda expressions
Lambda expression is a special form of functions in Python. In general, lambda expressions are used without a name so we do not define them with the def keyword like normal functions.
The main motivations behind the lambda expressions are simplicity and practicality. They are one-liners and usually only used at once.
The agg function accepts lambda expressions. Thus, we can perform more complex calculations and transformations along with the groupby function.
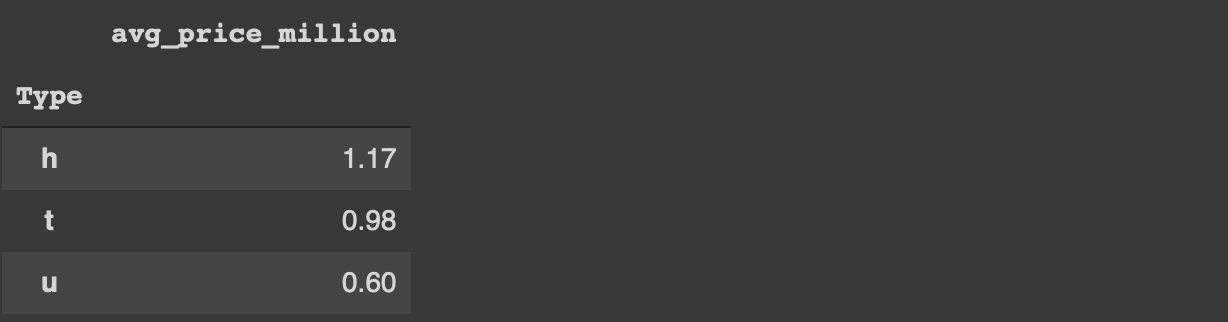
For instance, we can calculate the average price for each type and convert it to millions with one lambda expression.
df[['Type','Price']].groupby('Type').agg(
   avg_price_million = ('Price', lambda x: x.mean() / 1_000_000)
).round(2)
3. As_index parameter
The groupby functions assigns the groups to the index of the returned dataframe. In case of nested groups, it does not look nice.
df[['Type','Regionname', 'Distance']]\
.groupby(['Type','Regionname']).mean().head()
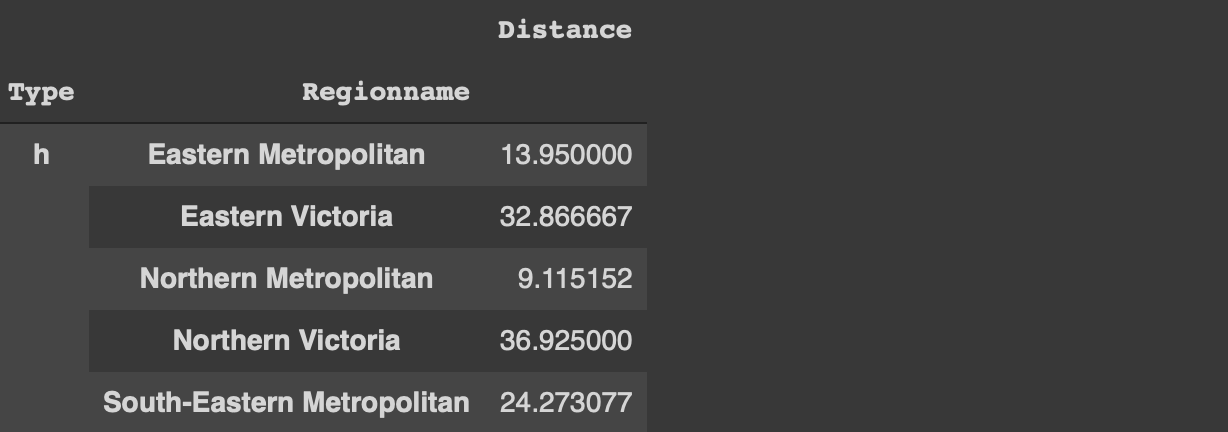
If we want to perform analysis on this dataframe later on, it is not practical to have the type and region name columns as index. We can always use the reset_index function but there is a more optimal way.
If the as_index parameter of the groupby function is set to false, the grouped columns are represented as columns instead of index.
df[['Type','Regionname', 'Distance']]\
.groupby(['Type','Regionname'], as_index=False).mean().head()

4. Missing values
The groupby function ignores the missing values by default. Let’s first update some of the values in the type column as missing.
df.iloc[100:150, 0] = np.nan
The iloc function selects row-column combinations by using indices. The code above updates the rows between 100 and 150 of the first column (0 index) as missing value (np.nan).
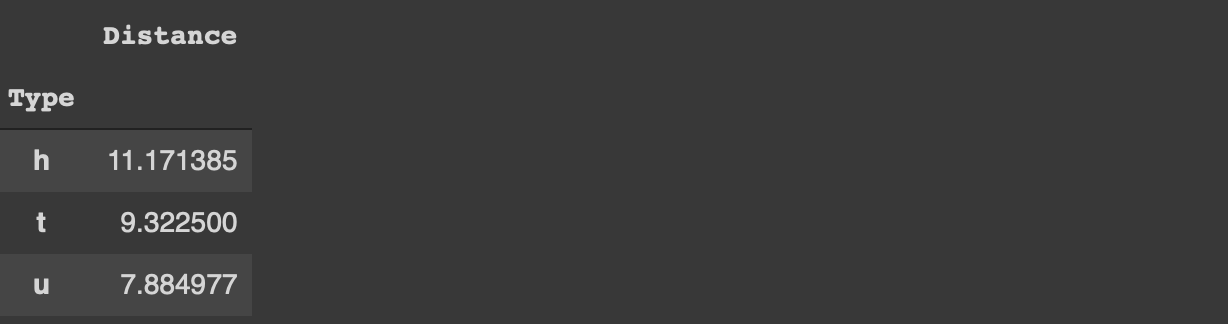
If we try to calculate the average distance for each category in the type column, we will not get any information about the missing values.
df[['Type','Distance']].groupby('Type').mean()
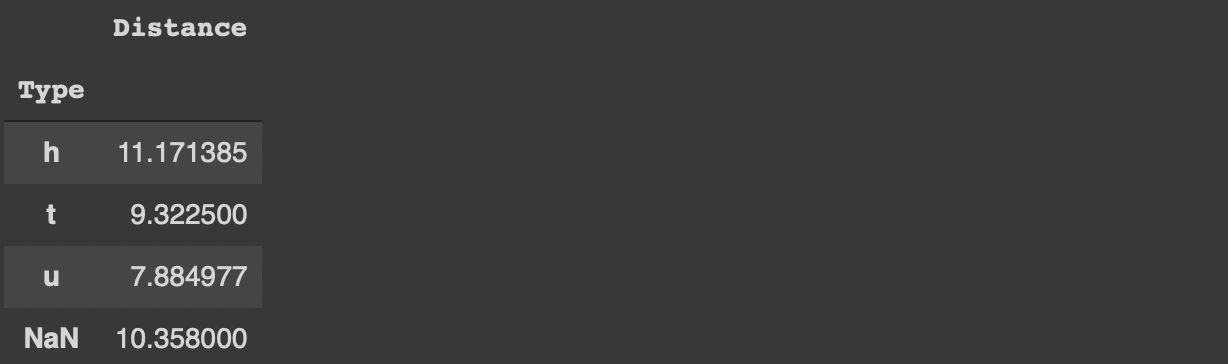
In some case, we also need to get an overview of the missing values. It may affect how we aim to handle the them. The dropna parameter of the groupby function is used to also calculate the aggregations on the missing values.
df[['Type','Distance']].groupby('Type', dropna=False).mean()
Conclusion
The groupby functions is one of the most frequently used functions in the exploratory data analysis process. It provides valuable insight into the relationships between variables.
It is important to use the groupby function efficiently to boost the data analysis process with Pandas. The 4 tips we have covered in this article will help you make the most of the groupby function.
Thank you for reading. Please let me know if you have any feedback.