
Time Series Analysis with Facebook Prophet: How it works and How to use it
An explanation of the math behind facebook profit and how to tune the model using COVID-19 data as an example.
Time series data can be difficult and frustrating to work with, and the various algorithms that generate models can be quite finicky and difficult to tune. This is particularly true if you are working with data that has multiple seasonalities. In addition, traditional time series models like SARIMAX have many stringent data requirements like stationarity and equally spaced values. Other time series models like Recurring Neural Networks with Long-Short Term Memory (RNN-LSTM) can be highly complex and difficult to work with if you don’t have a significant level of understanding about neural network architecture. So for the average data analyst, there is a high barrier of entry to time series analysis. So in 2017, a few researchers at Facebook published a paper called, “Forecasting at Scale” which introduced the open-source project Facebook Prophet, giving quick, powerful, and accessible time-series modeling to data analysts and data scientists everywhere.
To further explore Facebook Prophet, I’m going to first summarize the math behind it and then go over how to use it in Python (although it can also be implemented in R).
What is Facebook Prophet and how does it work?
Facebook Prophet is an open-source algorithm for generating time-series models that uses a few old ideas with some new twists. It is particularly good at modeling time series that have multiple seasonalities and doesn’t face some of the above drawbacks of other algorithms. At its core is the sum of three functions of time plus an error term: growthg(t), seasonality s(t), holidays h(t) , and error e_t :

The Growth Function (and change points):
The growth function models the overall trend of the data. The old ideas are should be familiar to anyone with a basic knowledge of linear and logistic functions. The new idea incorporated into Facebook prophet is that the growth trend can be present at all points in the data or can be altered at what Prophet calls “changepoints”.
Changepoints are moments in the data where the data shifts direction. Using new COVID-19 cases as an example, it could be due to new cases beginning to fall after hitting a peak once a vaccine is introduced. Or it could be a sudden pick up of cases when a new strain is introduced into the population and so on. Prophet can automatically detect change points or you can set them yourself. You can also adjust the power the change points have in altering the growth function and the amount of data taken into account in automatic changepoint detection.
The growth function has are three main options:
- Linear Growth: This is the default setting for Prophet. It uses a set of piecewise linear equations with differing slopes between change points. When linear growth is used, the growth term will look similar to the classic
y = mx + bfrom middle school, except the slope(m) and offset(b) are variable and will change value at each changepoint. - Logistic Growth: This setting is useful when your time series has a cap or a floor in which the values you are modeling becomes saturated and can’t surpass a maximum or minimum value (think carrying capacity). When logistic growth is used, the growth term will look similar to a typical equation for a logistic curve (see below), except it the carrying capacity (C) will vary as a function of time and the growth rate (k) and the offset(m) are variable and will change value at each change point.
- Flat: Lastly, you can choose a flat trend when there is no growth over time (but there still may be seasonality). If set to flat the growth function will be a constant value.
The Seasonality Function:
The seasonality function is simply a Fourier Series as a function of time. If you are unfamiliar with Fourier Series, an easy way to think about it is the sum of many successive sines and cosines. Each sine and cosine term is multiplied by some coefficient. This sum can approximate nearly any curve or in the case of Facebook Prophet, the seasonality (cyclical pattern) in our data. All together it looks like this:

If the above is difficult to decipher, I recommend this simple breakdown of the Fourier Series or this video on the intuition behind the Fourier series.
If you are still struggling to understand the Fourier series, do not worry. You can still use Facebook Prophet because Prophet will automatically detect an optimal number of terms in the series, also known as the Fourier order. Or if you are confident in your understanding and want more nuance, you can also choose the Fourier order based on the needs of your particular data set. The higher the order the more terms in the series. You can also choose between additive and multiplicative seasonality.
The Holiday/Event Function:
The holiday function allows Facebook Prophet to adjust forecasting when a holiday or major event may change the forecast. It takes a list of dates (there are built-in dates of US holidays or you can define your own dates) and when each date is present in the forecast adds or subtracts value from the forecast from the growth and seasonality terms based on historical data on the identified holiday dates. You can also identify a range of days around dates (think the time between Christmas/New Years, holiday weekends, thanksgiving’s association with Black Friday/Cyber Monday, etc).
How to use and tune Facebook Prophet
It can be implemented in R or Python, but we’ll focus on use in Python in this blog. You’ll need at least Python 3.7. To install:
$pip install pystan
$pip install fbprophet
Prepare the data
After reading in data and cleaning using pandas, you are almost ready to use Facebook Prophet. However, Facebook Prophet requires that the dates of your time series are located in a column titled ds and the values of the series in a column titled y. Note that if you are using logistic growth you’ll also need to add additional cap and floor columns with the maximum and minimum values of the possible growth at each specific time entry in the time series.
For demonstration, we’ll use new COVID-19 cases tracked by the New York Times on Github. First, we read and prepare the data in the form above. It doesn’t seem like there is logistic growth here so we’ll just focus on creating the ds and y columns:
Run a basic Facebook Prophet model
Facebook Prophet operates similarly to scikit-learn, so first we instantiate the model, then call .fit(ts) passing the time series through it. When calling .predict(ts), Prophet outputs a lot of information. Luckily, the developers added a method called .make_future_dataframe(periods = 10) that will easily collect all of the output in an organized way. This method outputs an empty pandas dataframe that we will fill with the forecast using the .predict(ts)method. The forecast will contain a prediction for every historical value present in the dataset plus additional forecasts for the number of periods passed through the method (in the case above 10). There are many columns of useful information in this future dataframe but the most important ones are:
dscontains the timestamp entry of the forecastyhatcontains the forecasted value of the time seriesyhat_lowercontains the bottom of the confidence interval for the forecastyhat_uppercontains the bottom of the confidence interval for the forecast
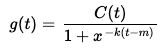
A .plot() function is also provided for easy plotting of the original data, the forecast and the confidence interval of the model. In this first iteration of the model we will allow Prophet to automatically choose the hyperparameters:
This outputs the following plotted forecast:
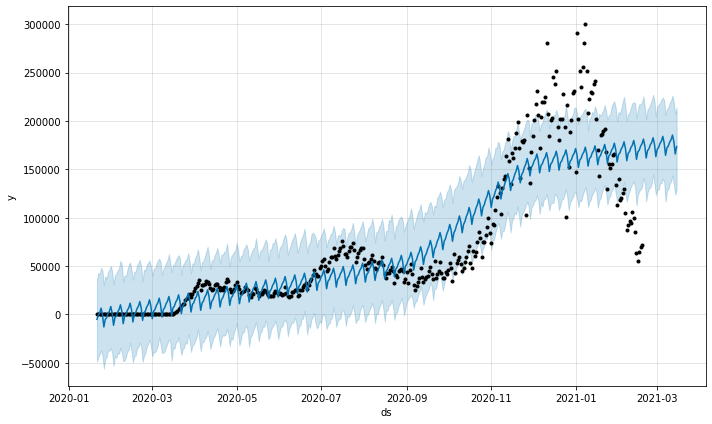
You can also add changepoints to the above plot by adding the following code:
Seems pretty decent, considering we didn’t tune any hyperparameters! Prophet picked up on a weekly seasonality of newly reported cases (probably due to differing weekend hours of testing sites) and an overall upward trend. It also added change points when during the summer and fall to better model the large increase in the rate of new cases. However, it doesn’t visually seem like a great model overall and misses many key trends in the original data. So we’ll need to tune it to get a better assessment of what is going on.
Tuning Facebook Prophet
Let’s fix some of the key problems our above model has:
- Misses the downturn: Prophet was unable to incorporate the downturn in new COVID cases after the new year. This is because the default setting for the range of data points considered when identifying changepoints is the first 80% of data in the time series. We can fix this by setting
changepoint_range = 1when instantiating the model which will incorporate 100% of the data. In other situations, it may be good to keep the changepoint range at 80% or lower to ensure that the model doesn’t overfit your data and can understand the last 20% on its own. But, in this case, because we are just trying to accurately model what has happened so far, we’ll allow the adjustment to 100%. - Strength of changepoints: While its great prophet was able to create change points, it visually seems like some of the changepoints are quite weak in impact on the model, or possibly there aren’t enough changepoints. The
changepoint_prior_scaleand then_changepointshyperparameters allow us to adjust this. By default,changepoint_prior_scaleit is set to 0.05, increasing this value allows the automatic detection of more change points and decreases it allows for less. Alternatively, we can specify a number of changepoints to detect usingn_changepointsor list the changepoints ourselves usingchangepoints. Be careful with this, as too many changepoints may cause overfitting. - Possible overfitting due to seasonality: While it’s cool that it picked up on the weekly seasonality of new cases, in this particular context it’s more important to understand the overall trend of cases to possibly predict when the pandemic will end. Prophet has built-in hyperparameters to allow you to adjust daily, weekly and yearly seasonality. So we can fix this by setting
weekly_seasonality = False. Alternatively, we could try to create our own custom seasonality and adjust the Fourier order using the.add_seasonality()method or we could dampen the automatic seasonality using theseasonality_prior_scalehyperparameter. However, in this case, it might be a little overkill to use either of those options
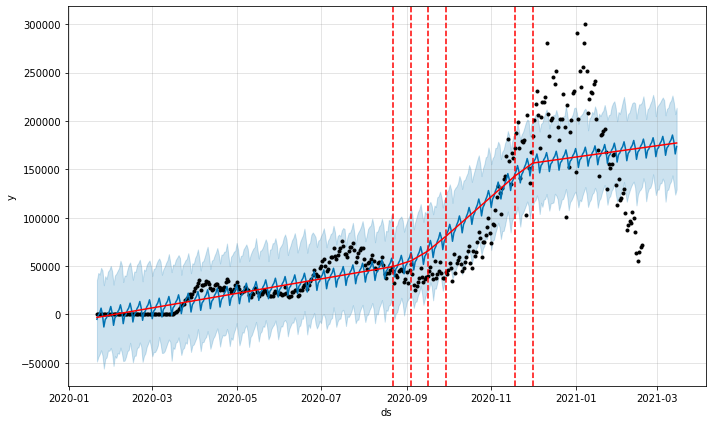
Running the model again with these changes yields:
Wow! With three small changes to the hyperparameters, we have a pretty accurate model of the behavior of new COVID cases over the past year. In this model, it predicts that cases will be near zero in early March. This is probably unlikely, as cases will probably decrease asymptotically.
Facebook Prophet is easy to use, fast, and doesn’t face many of the challenges that some other kinds of time-series modeling algorithms face (my favorite is that you can have missing values!). The API also includes documentation on how to use walk forward and cross validation, incorporate exogenous variables, and more. You can also check out this GitHub repository for the Jupyter Notebooks containing the code used in this blog.