
2021년 3월 21일 모바일 게임 매출 순위
| Rank | Game | Publisher |
|---|---|---|
| 1 | 리니지2M | NCSOFT |
| 2 | 리니지M | NCSOFT |
| 3 | Cookie Run: Kingdom – Kingdom Builder & Battle RPG | Devsisters Corporation |
| 4 | 기적의 검 | 4399 KOREA |
| 5 | Genshin Impact | miHoYo Limited |
| 6 | 삼국지 전략판 | Qookka Games |
| 7 | 그랑사가 | NPIXEL |
| 8 | V4 | NEXON Company |
| 9 | 세븐나이츠2 | Netmarble |
| 10 | 라이즈 오브 킹덤즈 | LilithGames |
| 11 | 원펀맨: 최강의 남자 | GAMENOW TECHNOLOGY |
| 12 | 바람의나라: 연 | NEXON Company |
| 13 | 뮤 아크엔젤 | Webzen Inc. |
| 14 | PUBG MOBILE | KRAFTON, Inc. |
| 15 | 미르4 | Wemade Co., Ltd |
| 16 | A3: 스틸얼라이브 | Netmarble |
| 17 | 메이플스토리M | NEXON Company |
| 18 | 블레이드&소울 레볼루션 | Netmarble |
| 19 | S.O.S:스테이트 오브 서바이벌 | KingsGroup Holdings |
| 20 | R2M | Webzen Inc. |
| 21 | Roblox | Roblox Corporation |
| 22 | KartRider Rush+ | NEXON Company |
| 23 | FIFA ONLINE 4 M by EA SPORTS™ | NEXON Company |
| 24 | Brawl Stars | Supercell |
| 25 | 검은강호2: 이터널 소울 | 9SplayDeveloper |
| 26 | 리니지2 레볼루션 | Netmarble |
| 27 | 프린세스 커넥트! Re:Dive | Kakao Games Corp. |
| 28 | 달빛조각사 | Kakao Games Corp. |
| 29 | 카운터사이드 | NEXON Company |
| 30 | Gardenscapes | Playrix |
| 31 | Pmang Poker : Casino Royal | NEOWIZ corp |
| 32 | AFK 아레나 | LilithGames |
| 33 | Empires & Puzzles: Epic Match 3 | Small Giant Games |
| 34 | 찐삼국 | ICEBIRD GAMES |
| 35 | 갑부: 장사의 시대 | BLANCOZONE NETWORK KOREA |
| 36 | Top War: Battle Game | Topwar Studio |
| 37 | Age of Z Origins | Camel Games Limited |
| 38 | Cookie Run: OvenBreak – Endless Running Platformer | Devsisters Corporation |
| 39 | 라그나로크 오리진 | GRAVITY Co., Ltd. |
| 40 | 가디언 테일즈 | Kakao Games Corp. |
| 41 | 한게임 포커 | NHN BIGFOOT |
| 42 | Lords Mobile: Kingdom Wars | IGG.COM |
| 43 | FIFA Mobile | NEXON Company |
| 44 | 검은사막 모바일 | PEARL ABYSS |
| 45 | Homescapes | Playrix |
| 46 | 컴투스프로야구2021 | Com2uS |
| 47 | Epic Seven | Smilegate Megaport |
| 48 | 이카루스 이터널 | LINE Games |
| 49 | 붕괴3rd | miHoYo Limited |
| 50 | 에오스 레드 | BluePotion Games |
You’re Not Realizing the Full Value of Your Company’s Data -번역
귀하는 회사의 데이터의 전체 가치를 실현하지 못합니다.
회사의 데이터 분석을 단순한 기업 Buzzword 이상으로 전환하는 방법

이 기사는 공동 작성되었습니다모세, CEO 및 공동 창업자몬테 카를로, 그리고jit papneja., 글로벌 통찰력 및 amp;코카콜라 회사 인 Johnson & AMP를 포함한 여러 Fortune 100 회사의 분석 리더존슨, 네슬레.
당신은 눈송이와 보더에 있니?큰.그러나 대부분의 회사에서는 클라우드 데이터 스택을 갖는 대부분의 회사에서는 데이터 및 분석을 규모의 데이터와 분석을 작동 할 때 빙산의 일각에 불과합니다.우리는 나눈다5 개의 분명하지 않은로드 블록기업은 데이터가 주도되면 직면하고 업계 최고의 데이터 엔지니어링 및 분석 팀 중 일부가이를 극복하기 위해 수행하는 작업을 강조합니다.
에 2021, “데이터 기반”또는 “데이터 먼저”로 여겨지는 회사를 찾으려면 어려워집니다.그러나 대부분의 경우 데이터 분석은 중요한 비즈니스 가치의 혁신적인 원인이 아닌 Buzzword입니다.
비즈니스의 데이터 분석 전략이 완전한 잠재력에 도달하기 위해서는 전체 조직 전체에서 데이터 감사의 문화 및 채택 문화를 구축해야합니다.우리는 분석적 우수성의 방식에 서있는 가장 흔한 도전 중 5 가지를 공유합니다. 그리고 어떻게 그들을 태클 할 수 있는지.
도전 # 1 : 너무 많은 조종사, 너무 적은 이니셔티브가 너무 적습니다.
여러 번, 데이터는 완전히 생산되는 프로젝트가 아닌 조종사 및 실험의 맥락에서 실리콘 문제를 해결하는 데 사용됩니다.이것은 특히 데이터 중심 엔터프라이즈를 구축하는 초기 단계에서는 일반적이지만 나중에보다는 더 빨리 주소 해야하는 지뢰입니다.
너무 많은 조종사는 나머지 회사에서 오해가 발생합니다.이 데이터는 실험을 위해 비즈니스 가치를 창출하지 않습니다.이 지각은 바이 인을 건설하기가 어렵고 데이터 및 분석의 가능한 가치에 대한 공유를 이해하기가 어렵습니다.
가능한 한 신속하게 데이터 및 분석 비전을 전반적인 비즈니스 전략으로 정렬하여 전략적 위치로 이동하십시오.데이터 및 분석 솔루션이 가장 중요한 요소에서 명시 적으로 명시 적으로 전달할 수있는 우선 순위를 식별하고 갇힌 가치를 신속하게 생산하는 것으로 신속하게 이동하여 갇힌 가치를 잠금 해제하는 작업을 수행 할 수 있습니다.
핵심 우선 순위를 확인하면 스스로에게 물어보십시오. 데이터 및 분석 솔루션의 목표는 무엇입니까?어떤 비즈니스 질문에 대답하려고합니까?그리고 비즈니스 리더가 귀하의 업무를 기반으로하는 행동을하는 어떤 행동은 무엇입니까?이러한 이니셔티브가 어떤 가치를 창출합니까?
Challenge #2: Organizational bottlenecks
구조화 된 데이터가 잘 갖추어져 있더라도 올바른 팀에 적합한 스킬 세트를 사용하여 올바른 팀을 사용해야합니다.문제를 해결하기 위해 데이터를 해결하기 위해 데이터를 활용하는 방법에 대한 화려한 아이디어를 개발하는 것과 동일한 팀은 해결책을 테스트하고 확장하고 병목 현상을 만들고 데이터 백업 이니셔티브에 대한 신뢰를 침식 할 수 있도록 장비가 없습니다.
이 과제를 해결하기위한 검증 된 접근법은 전용 허브가 전략 및 거버넌스, 인재 관리를 소유하고 있으며 전체 조직 전체가 레버리지를위한 전사적 인 데이터 및 분석 서비스를 제공하는 전용 허브와 함께 “허브 / 스포크”모델을 채택하는 것입니다.
“허브”는 기업에 적합한 기능을 통해 중요한 서비스를 제공하여 비즈니스 가치를 가속화합니다.”Spoke”팀은 기능적 인도 지식, 기능별 기술을 설정하고 기능적 요구와 프로세스를 더 잘 이해할 때 기능 데이터 및 분석 이니셔티브를 기능적으로 실행하고 기능 데이터 및 분석 이니셔티브를 실행합니다.”Spokes”는 “허브”가 설정 한 공통 지침과 원칙을 따르며 “허브”가 챔피언을받은 교차 기능적 엔터프라이즈 넓은 이니셔티브의 채택 및 가치 실현에 대해 책임을집니다.또한 자율적으로 일하는 자신의 정의 된 목표를 가진 자체적으로 일하는 팀의 교차 기능 팀 인 민첩한 배달 분대를 형성해야합니다.각 분대에는 ‘제품 소유자’가 있으며 작업을 완전 순위 지정합니다.
단계를 찍어 조직 구조를 조사하십시오. 올바른 도구로 재능이 올바른 믹스와 아이디어를 완전한 생산에 대한 보증을 받기 위해 액세스 할 수 있습니까?분명히 역할과 책임과 일하는 방법을 명확하게 정의 했습니까? 팀은 한 팀, 한 팀, 한 목소리로, 한 팀으로 기능합니까?
Challenge #3: Lots of data but little insight
회사는 분석에서 ROI를 향상 시키려고 할 때 데이터 자체는 거의 도움이되지 않습니다. 직원들이 많은 양의 데이터로 인해 의미있는 통찰력을 활용할 수있는 능력입니다.팀은 어떤 목적을 찾을 수 있는지, 어디에서 액세스 할 수 있는지에 사용되는 데이터를 알아야합니다.우리는이 데이터 민주화를 호출합니다.
이 과제를 해결하기 위해 두 가지 주요 최종 목표 직원이 데이터에 대한 단일 진리의 원인을 가져야하며 조직은 오용되거나 낭비되어서는 안되는 전략적, 가치있는 자산으로 데이터를 처리해야합니다.
이것은 간단한 작업이 아닙니다.팀 팀은 공통 데이터 수집 프레임 워크를 구현하고 표준 데이터 거버넌스 프로그램을 도입함으로써 여러 가지 교차 기능 팀을 여러 개를 수행해야합니다.검증 된 데이터 카탈로그 시스템을 구현해야하므로 직원들이 전체 조직에서 공유되는 데이터 세트를 찾고 액세스 할 수 있으며 일상 업무에서 사용할 수있는 신뢰할 수있는 데이터가 있음을 신뢰할 수 있습니다.
큰 업적은 밤새도록 일어나지 않지만 지도자들은 당신의 팀을 보여주는 정보 세션이나 ‘점심 식사’를 호스팅하여 모멘텀을 시작할 수 있습니다.
데이터 민주화로 이동하면서 자신에게 물어보십시오.명확하게 정의 된 데이터 전략이 있습니까?전략을 어떻게 전달하고 전체 조직 내에서 식욕을 구축하여 데이터 및 분석에 대한 공유 접근 방식을 채택 할 수 있습니까?
Challenge #4: Trying to be everything for everyone
기계 학습 및 기타 AI 분야에서는 분석을 생성하고 확장하는 동안 수익성 높은 성장을 위해 강력한 솔루션으로 부상했습니다.그러나 ML과 AI를 채택하기 위해 많은 회사가 서두르므로 데이터 및 분석 리더는 모든 사람을위한 모든 것으로 간주하는 도전과 직면합니다. 새로운 기술과 방법론을 적용 할 수 있는지 여부를 결정하기 위해 멈추지 않아도됩니다.
첫 번째 도전과 비슷합니다.데이터 프로그램에 AI를 소개합니다, 기계 학습 및 기타 자동화 된 솔루션이 가장 효과적 일 수있는 문제를 확인하여 의미있는 비즈니스 성과를 유도합니다.
예를 들어, 심각한 데이터 전략의 필요한 데이터 품질 관리는 종종 상당한 수동 임계 값 설정 및 메타 데이터 항목이 필요합니다.ML-first 접근법엔드 투 엔드 데이터 관찰 가능성,데이터 엔지니어 및 분석가가 Ad Hoc Firefighting 또는 수동 수고와는 달리 실제로 바늘을 움직이는 프로젝트에 집중할 수 있습니다.데이터 팀과 함께 지출그들의 시간의 80 %기업매년 1,500 만 달러 낭비데이터 품질 문제에 따라 데이터 관찰 가능성을 통해 팀은 전체 조직에 데이터를 적용 할 때 거의 데이터 정확성을 높일 수 있습니다.
ML은 또한 우버와 같은 예측을하는 데 사용됩니다.그 드라이버를 지시합니다수요가 급증하거나 Airbnb의 방법에 관한 지역으로수익을 극대화 할 수있는 가격을 추천합니다동적 시장에서.모든 경우에, 예측의 품질은 기계 학습 모델을 훈련시키는 데 사용되는 데이터의 품질에 전적으로 의존합니다.
사용자 정의 모델을 작성하려는 경우 먼저 프로젝트 정의를 수행 할 수있는 충분한 데이터가 있는지 확인하고 재생할 가능성이있는 잠재적 인 편향을 알고 있어야합니다.
AI와 ML을 활용하기 전에 다음과 같이 답하십시오.우리의 데이터 세트는 수동 감독을 제거하기에 충분하고 정확하게 정확합니까?바이어스가 연주 될 수있는 점을 확인 했습니까?감지하고 수정하는 방법그들?다시 말하지만, 이것은 데이터 관찰 가능성에 대한 강력한 접근 방식이 도움이 될 수있는 곳입니다.
Challenge #5: Security, privacy, and governance
항상 그렇듯이 보안 및 개인 정보는 데이터 프로그램의 성공에 영향을 미치는 영향을 미칩니다.사일로를 분해하고 데이터에 대한 액세스를 늘리기 위해 작업하는 경우 모든 액세스 포인트 및 파이프 라인을 포함한 데이터가 안전하게 해당 데이터가 안전합니다.
오른쪽 데이터 거버넌스 접근 방식을 일찍 켜고 장기적인 목표와 결과를 염두에두고 시간이 지남에 따라 분석을보다 쉽게 구현하고 확장하는 데 도움이됩니다.전체 데이터 스택을 포함하여야합니다창고,카탈로그및 BI 플랫폼은 데이터 거버넌스를 준수합니다.가이드 라인귀하의 회사, 산업 및 지역.
이러한 모든 과제는 모두 중요하지만, 범위가 아닙니다.이러한 모범 사례, 전략적 비전 및 올바른 기술을 통해 데이터 분석 프로그램은 모든 비즈니스 단위에서 의미있는 변화를 주도 할 수 있으며 수년간 힘 곱셈기가됩니다.
귀하의 회사에서 데이터 분석 전략을 구현 하시겠습니까?우리는 모두 귀입니다!도달하다모세또는jit papneja.…에
우리가 무엇을 위해 우리가 무엇인지에 대해 자세히 알아 보려면몬테 카를로회사가 이러한 병목 현상을 극복하고 신뢰할 수있는 데이터를 달성하도록 돕기 위해,우리를 확인하십시오…에!
You’re Not Realizing the Full Value of Your Company’s Data
You’re Not Realizing the Full Value of Your Company’s Data
How to turn your company’s data analytics into more than just a corporate buzzword
This article was co-written by Barr Moses, CEO and co-founder of Monte Carlo, and Jit Papneja, a global insights & analytics leader at several Fortune 100 companies, including The Coca-Cola Company, Johnson & Johnson, and Nestlé.
You’re on Snowflake and Looker? Great. But for most companies, having a cloud data stack is just the tip of the iceberg when it comes to operationalizing their data and analytics at scale. We share five non-obvious roadblocks businesses face when becoming data driven and highlight what some of the industry’s leading data engineering and analytics teams are doing to overcome them.
In 2021, you’ll be hard-pressed to find a company that doesn’t want to be seen as “data-driven” or “data-first.” Yet for most, data analytics is just a buzzword, not an innovative source of critical business value.
In order for your business’s data analytics strategy to reach its full potential, you have to build a culture of data appreciation and adoption across the entire organization. We share five of the most common challenges that stand in the way of analytics excellence — and how you can tackle them.
Challenge #1: Too many pilots, too few scaled initiatives
Many times, data is used to solve siloed problems within the context of pilots and experiments, not fully productionalized projects. This is common, especially in the early stages of building a data-driven enterprise, but it’s a landmine you should address sooner rather than later.
Too many pilots create a misperception in the rest of the company — that data is for experiments, not creating business value. This perception makes it difficult to start building buy-in and a shared understanding of the possible value of data and analytics.
As swiftly as possible, move to a strategic position by aligning your data and analytics vision with your overall business strategy. Identify priorities where data and analytics solutions can explicitly deliver on the most critical elements — and work to unlock trapped value by quickly moving proven proofs-of-concept pilots into production.
As you identify key priorities, ask yourself — what is the goal of your data and analytics solutions? What business questions are you trying to answer? And what actions will you empower business leaders to take based on your work? What value these initiatives will create?
Challenge #2: Organizational bottlenecks
Even if you have well-structured data in place, you need to have the right people with the right skill sets on the right teams to make use of it. The same team that develops a brilliant idea for how to leverage data to solve a problem may not be equipped to test and scale up the solution, creating bottlenecks and eroding confidence in data-backed initiatives.
One proven approach to address this challenge is to adopt a “Hub-and-Spoke” model, with a dedicated hub owning the strategy and governance, talent management, and providing a companywide set of data and analytics services for the entire organization to leverage.
“Hub” accelerates business value by delivering critical services with the right capabilities to the enterprise. “Spoke” teams work on functional roadmaps and execute functional data and analytics initiatives as they have deep functional knowledge, function-specific skill set and understand functional needs and processes better. “Spokes” follow common guidelines and principles set by the “hub”, and are accountable for adoption and value realization of cross-functional enterprise wide initiatives, championed by “Hub.” You should also form agile delivery squads, a cross-functional team of teams with its own defined goal, which they work towards autonomously. Each squad has a ‘product owner’ and prioritize work to be done.
Take a step back and examine your organizational structure. Do you have the right mix of talent with the right tools and access to take an idea to a proof-of-concept to full production? Do you have clearly defined roles and responsibilities and ways of working? Are teams function as One Team, in One Voice, and towards One Goal?
Challenge #3: Lots of data but little insight
When companies try to improve their ROI on analytics, the data itself is rarely the challenge — it’s the ability for employees to glean meaningful insights from a large volume of data. Teams need to know what data is used for which purpose, where they can find it, and how they can access it. We call this data democratization.
To address this challenge, set two major end goals employees should have a single source of truth for data, and the organization should treat data as a strategic, valuable asset that shouldn’t be misused or wasted.
This is not a simple task. The team of teams need to work across several cross-functional teams to get data out of siloed ownership by implementing a common data acquisition framework, and introducing a standard data governance program. You should also implement a proven data catalog system, which enables employees to find and access datasets shared across the entire organization, and to trust that it has reliable data to use in their daily work.
Big accomplishments don’t happen overnight, but leaders can start building momentum by hosting informational sessions or ‘lunch and learns’ that show your teams how to leverage the data and analytics they can access right now in their day-to-day jobs.
As you move towards data democratization, ask yourself: Do you have a clearly defined data strategy? How can you communicate your strategy, and build an appetite within your entire organization to adopt a shared approach to data and analytics?
Challenge #4: Trying to be everything for everyone
Machine learning and other AI disciplines have emerged as powerful solutions for driving profitable growth while generating and scaling analytics. However, as many companies rush to adopt ML and AI, data and analytics leaders face the challenge of trying to be everything for everyone — applying new technologies and methodologies simply because you could, without stopping to determine if you should.
Similar to the first challenge, as you start to introduce AI into your data program, begin by identifying the problems where machine learning and other automated solutions can be most effective and drive meaningful business outcomes.
For example, data quality management, a necessary component of any serious data strategy, often requires significant manual threshold setting and metadata entry. ML-first approaches, like end-to-end data observability, allows data engineers and analysts to focus on projects that actually move the needle, as opposed to ad hoc firefighting or manual toil. With data teams spending 80 percent of their time and companies wasting $15 million annually on data quality issues, data observability enables teams to increase data accuracy with little effort as you apply data across the entire organization.
ML is also used to make predictions, such as how Uber directs its drivers to an area about to surge in demand or how Airbnb recommends prices to maximize revenue in dynamic markets. In every case, the quality of the predictions are entirely dependent on the quality of the data used to train the machine learning models.
If you plan to build custom models, first make sure you have enough data to do the project justice — and be aware of the potential biases that will likely come into play.
Answer the following before leveraging AI and ML: Are our datasets clean enough and accurate enough to remove manual oversight? Have we identified the points where biases may come into play, and do we know how to detect and correct them? Again, this is where a robust approach to data observability can help.
Challenge #5: Security, privacy, and governance
As always, security and privacy are ever-present factors that will impact the success of your data program. As you work to break down silos and increase access to data, you need to make sure that data — including every access point and pipeline it touches — is secure.
Getting the right data governance approach in place early on, with your long-term goals and outcomes in mind, will help you implement and scale analytics more easily over time. You should ensure your entire data stack, including warehouses, catalogs, and BI platforms, are compliant with data governance guidelines for your company, industry and region.
All of these challenges are significant, but not insurmountable. With these best practices, a strategic vision, and the right technology, your data analytics program can drive meaningful change across every business unit and be a force multiplier for years to come.
Implementing a data analytics strategy at your company? We’re all ears! Reach out to Barr Moses or Jit Papneja.
To learn more about what we’re up at Monte Carlo to help companies overcome these bottlenecks and achieve reliable data, check us out!
2021년 3월 20일 모바일 게임 매출 순위
| Rank | Game | Publisher |
|---|---|---|
| 1 | 리니지2M | NCSOFT |
| 2 | 리니지M | NCSOFT |
| 3 | Cookie Run: Kingdom – Kingdom Builder & Battle RPG | Devsisters Corporation |
| 4 | 기적의 검 | 4399 KOREA |
| 5 | Genshin Impact | miHoYo Limited |
| 6 | 삼국지 전략판 | Qookka Games |
| 7 | 그랑사가 | NPIXEL |
| 8 | V4 | NEXON Company |
| 9 | 세븐나이츠2 | Netmarble |
| 10 | 라이즈 오브 킹덤즈 | LilithGames |
| 11 | 원펀맨: 최강의 남자 | GAMENOW TECHNOLOGY |
| 12 | 바람의나라: 연 | NEXON Company |
| 13 | 뮤 아크엔젤 | Webzen Inc. |
| 14 | PUBG MOBILE | KRAFTON, Inc. |
| 15 | 미르4 | Wemade Co., Ltd |
| 16 | A3: 스틸얼라이브 | Netmarble |
| 17 | 메이플스토리M | NEXON Company |
| 18 | 블레이드&소울 레볼루션 | Netmarble |
| 19 | S.O.S:스테이트 오브 서바이벌 | KingsGroup Holdings |
| 20 | R2M | Webzen Inc. |
| 21 | Roblox | Roblox Corporation |
| 22 | KartRider Rush+ | NEXON Company |
| 23 | FIFA ONLINE 4 M by EA SPORTS™ | NEXON Company |
| 24 | Brawl Stars | Supercell |
| 25 | 검은강호2: 이터널 소울 | 9SplayDeveloper |
| 26 | 리니지2 레볼루션 | Netmarble |
| 27 | 프린세스 커넥트! Re:Dive | Kakao Games Corp. |
| 28 | 달빛조각사 | Kakao Games Corp. |
| 29 | 카운터사이드 | NEXON Company |
| 30 | Gardenscapes | Playrix |
| 31 | Pmang Poker : Casino Royal | NEOWIZ corp |
| 32 | AFK 아레나 | LilithGames |
| 33 | Empires & Puzzles: Epic Match 3 | Small Giant Games |
| 34 | 찐삼국 | ICEBIRD GAMES |
| 35 | 갑부: 장사의 시대 | BLANCOZONE NETWORK KOREA |
| 36 | Top War: Battle Game | Topwar Studio |
| 37 | Age of Z Origins | Camel Games Limited |
| 38 | Cookie Run: OvenBreak – Endless Running Platformer | Devsisters Corporation |
| 39 | 라그나로크 오리진 | GRAVITY Co., Ltd. |
| 40 | 가디언 테일즈 | Kakao Games Corp. |
| 41 | 한게임 포커 | NHN BIGFOOT |
| 42 | Lords Mobile: Kingdom Wars | IGG.COM |
| 43 | FIFA Mobile | NEXON Company |
| 44 | 검은사막 모바일 | PEARL ABYSS |
| 45 | Homescapes | Playrix |
| 46 | 컴투스프로야구2021 | Com2uS |
| 47 | Epic Seven | Smilegate Megaport |
| 48 | 이카루스 이터널 | LINE Games |
| 49 | 붕괴3rd | miHoYo Limited |
| 50 | 에오스 레드 | BluePotion Games |
Smashing silos with Domain Data Stores -번역
도메인 데이터 저장소가있는 사일로를 부수십시오
내에서다른 게시물ABN AMRO가 데이터 메쉬 스타일 아키텍처에서 데이터를 사용할 수있는 방법을 배웠습니다.이 blogpost에서는 큰 데이터 모노리스를 분해하는 방법에 대해 배웁니다.
데이터 중심 의사 결정 시프트
데이터웨어 하우스가 상품이 되었기 때문에 수년 동안 많은 경우 C가 많이 있습니다.하류영양.분산 시스템은 큰 인기를 얻었으며, 데이터는 더 크고 다양하고 다양한 데이터베이스 디자인이 튀어 나와 구름의 출현이 확장 성과 탄력을 증가시키기 위해 계산 및 저장을 분리했습니다.이러한 추세를 중앙 집중식에서 도메인 중심의 데이터 소유권으로 결합하면 데이터 집약적 인 응용 프로그램을 디자인 해야하는 방식을 변경하는 것의 중요성을 즉시 이해할 수 있습니다.
우리의 데이터 아키텍처에서 우리는 직접 데이터 소비와 새로운 데이터 생성 사이의 명확한 분할을했습니다.데이터 배포 아키텍처에서 읽을 수 있으므로여기과여기또한 데이터 저장소 (RDS)를 캡처하여 소비자에게 반복적으로 부족한 데이터를 반복적으로 제공하고 제공합니다.이 패턴에서는 데이터가 읽혀 지지만 새 데이터가 생성되지 않습니다.응용 프로그램이나 사용자가 소비하는 RDSS를 데이터 소스로 직접 사용하고 유사한 데이터 요소 간의 매핑을 기반으로 경량 통합을 수행 할 수 있습니다.이 모델의 큰 이점은 데이터 엔지니어링 팀이 새로운 데이터 모델을 생성하고 유지 관리 할 필요가 없습니다.새 데이터베이스로 데이터를 추출, 변환 및로드하지 않습니다.변화는 날아 오르지 만 이러한 결과는 영구적 인 새 집이 필요하지 않습니다.이 접근법은 복잡한 데이터 변환이 필요없는 데이터 탐색, 경량보고 및 간단한 분석 모델에 특히 유용합니다.
그러나 문제는 소비자의 요구가 RDSS가 제공하는 것을 초과 할 수 있다는 것입니다. 경우에 따라 새로운 데이터 생성에 대한 명확한 필요가 있습니다. 예를 들어 복잡한 비즈니스 로직과 새로운 비즈니스 통찰력을 창출하는 분석 모델이옵니다. 나중에 분석을 위해 이러한 통찰력을 보존하려면 예를 들어 데이터베이스 에서이 정보를 어딘가에 유지해야합니다. 또 다른 상황은 처리 될 필요가있는 데이터의 양이 RDS 플랫폼이 처리 할 수있는 것을 초과 할 수 있습니다. 이러한 경우에, 데이터 처리량; 예를 들어, 과거 데이터의 경우 데이터를 점진적으로 새로운 위치로 가져오고, 처리하고,이를 처리하고, 나중에 소비를 위해 사전 최적화하는 데 정당화 될 수 있습니다. 여러 가지 상황이 여러 가지 RDS가 결합되고 조화 될 필요가있을 때 일 것입니다. 일반적으로 많은 작업을 오케스트레이션하고 데이터를 함께 가져 오는 데 필요합니다. 사용자가 이러한 모든 작업이 완료 될 때까지 사용자를 기다리는 것은 사용자 환경에 부정적인 영향을 미칩니다. 이러한 영향은 우리에게 데이터 소비의 두 번째 패턴으로 이어집니다.도메인 데이터 저장소 (DDS)…에
도메인 데이터 저장소
우리는 동시에 민첩성이 증가하는 동안 새로 생성 된 데이터를보다 신중하게 관리하려고합니다.이것은 DDS가있는 것입니다.이러한 유형의 응용 프로그램은 데이터를 집중적으로 처리하고 새로 생성 된 데이터를 저장하고 소비자의 유스 케이스를 용이하게하는 역할을합니다.대규모로 가치를 잠금 해제하려면 데이터 엔지니어링 팀을위한 플랫폼이 포함 된 새로운 아키텍처를 설계했습니다.편면을보고 특성을 평가합시다.
우리가 상상하는 것은 새로운 데이터 기반 의사 사용 사례를 신속하게 전달할 수있는 생태계입니다.그것은 데이터 공학 및 집중적 인 처리를 용이하게하고, 통제력을 유지하고 기술의 확산을 보지 못하고는 아닙니다.우리는 비즈니스 특정 데이터 생성을 향한 일반 (Enterprise) 데이터 통합에서 전환을 예측합니다.통합 전문가에서 지역 사회 건물 및 원활한 협업을 전환합니다.및 단단한 데이터 모델에서보다 유연한 또는 “스키마 – 라이트”접근 방향으로의 시프트.
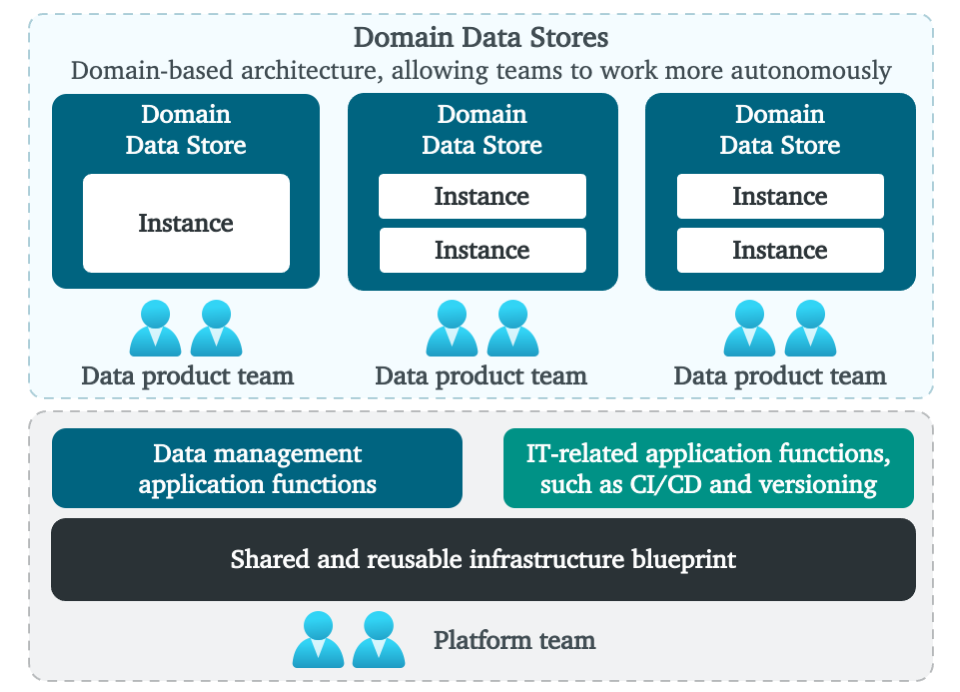
높은 수준의 생태계는 위 그림 1과 같습니다.빠른 데이터 섭취, 변환 및 사용을 허용하는 완전히 관리되는 플랫폼.하단에서 모든 데이터 엔지니어링 팀에서 복잡성을 숨기는 주된 목표는 관리되는 인프라를 볼 수 있습니다.셀프 서비스 방식으로 데이터 엔지니어링 팀을 지원하는 재사용 가능한 기능이 있습니다.여기에는 재사용 가능하고 관리되는 데이터베이스 기술, 중앙 모니터링 및 로깅, 계보, ID 및 액세스 관리, 오케스트레이션, CI / CD, 데이터 및 스키마 버전 관리, 배치, API 및 이벤트 기반 섭취를위한 패턴, 비즈니스 인텔리전스와의 통합 및 고급분석 기능 등등.underpinning 플랫폼은 팀 토폴로지 방식을 사용하여 관리됩니다. 중앙 플랫폼 팀은 다른 모든 팀을 지원하면서 기본 플랫폼을 관리합니다.주요 목적은 모든 서비스를 단순화하고 플랫폼을 관리하고 확보하고 데이터 엔지니어링 팀의 오버 헤드를 줄이는 것입니다.
위에는 데이터 엔지니어링 팀에서 데이터를 관리하는 DDS가 표시됩니다.이 도메인 팀은 데이터 제품, 고객 여정 또는 비즈니스 사용 사례에 중점을 둡니다.DDS 주변의 경계는 또한 데이터 책임을 결정합니다.여기에는 데이터 품질, 소유권, 통합 및 배포, 메타 데이터 등록, 모델링 및 보안이 포함됩니다.나중에 세분화와 도메인 경계로 돌아올 것입니다.
기능 요구 사항을 위해 우리는 비즈니스 목표와 목표가 잘 정의되고 자세한 및 완료되도록합니다.그들을 이해하는 것은 솔루션의 토대이며 해결해야 할 비즈니스 문제, 필요한 데이터 소스, 작동해야 할 솔루션, 실시간 또는 오프라인으로 데이터 처리를 수행 해야하는 경우, 무엇을 수행해야합니다.무결성과 요구 사항은 다른 도메인에서 재사용 할 수있는 것입니다.
비 기능 요구 사항의 경우, 우리는 어떤 종류의 데이터 저장소 기술 유형을 제공하는지 선택했습니다.각 데이터 저장소의 강도를 활용하기 위해 재사용 가능한 데이터베이스 기술이나 데이터 저장소 및 패턴 세트를 생각할 수 있습니다.예를 들어, 미션 크리티컬 및 전환 응용 프로그램은 강력한 일관성 모델을 사용하거나 비즈니스 인텔리전스와보고가 빠른 SQL 액세스를 제공하는 상점에서만 허용 될 수 있습니다.
다른 데이터 저장소는 데이터를 내부적으로 관리하고 구성합니다.하나의 일반적인 구성은 섭취, 정화, 큐어 처리, 조화, 서빙 등의 우려를 분리하는 것입니다.우리의 도메인 데이터 저장소에서는 폴더, 버킷, 데이터베이스 등과 같은 다양한 저장 기술을 가진 다양한 영역을 사용하는 것이 좋습니다.존은 또한 우리가 목적을 결합 할 수 있으므로 상점을 사용하여 동시에 운영 및 분석을 용이하게 할 수 있습니다.모든 상점과 구역에 대해 범위는 매우 명확해야합니다.
데이터 모델의 경우 리지드 데이터 모델에서 더 많은 “스키마 라이트”접근 방식으로 이동하도록 권장합니다.그러나 아키텍처 스타일은 허용됩니다.팀이 스키마를 읽거나 직접적으로 단순한 차원 모델을 구축하는 것을 선호하는 경우, 우리는 그들이 그렇게 할 것을 권장합니다.Kimball 또는 데이터 볼트 모델링도 적용 할 수 있습니다.그것은 모두 사용 사례의 요구와 크기에 달려 있으며, 이는 다음 주제로 가져옵니다.
도메인 데이터 저장소 세분화
우리가 엔터프라이즈 데이터웨어 하우스에서보다 세밀한 DDS 설계로 전환 할 때 우리는 세분화를 고려하고 데이터를 논리적으로 세그먼트해야합니다.논리 DDS 경계의 범위, 크기 및 배치를 결정하는 것은 어렵고 도메인간에 데이터를 배포 할 때 어려움을 유발합니다.일반적으로 경계는 주제 지향적이며 비즈니스 기능과 정렬됩니다.도메인의 논리적 경계를 정의 할 때 데이터 모델링 활동 및 도메인 내의 내부 데이터 배포를 용이하게하도록 하위 도메인으로 분해하는 값이 있습니다.
중요한 작업은 DDS의 논리적 역할에 대해 신중하게 생각하는 것입니다.이 덮개도 덮습니다비즈니스 입도과기술적 세분화:
- 비즈니스 입도는 최고 수준의 기능적 컨텍스트, 범위 (즉, ‘경계 컨텍스트’) 및 활동의 분석을 비즈니스 문제의 하향식 분해로 시작합니다.이들은 더 작은 ‘영역’, 사용 사례 및 비즈니스 목표로 나누어야합니다.이 연습에서는 효율적인 비즈니스 프로세스, 도메인, 기능 등을 나누는 방법에 대한 좋은 비즈니스 지식과 전문 지식을 필요로합니다. 모범 사례는 비즈니스 기능을 참조 모델로 사용하고 일반적인 용어 (유비쿼터스 언어) 및 중복 데이터 요구 사항을 연구하는 것입니다.
- 기술적 세분화는 재사용 성, 유연성 (자주 기능적 변경에 대한 쉬운 적응), 성능, 보안 및 확장 성과 같은 특정 목표를 향한 수행됩니다.핵심 균형은 올바른 절충을하는 것입니다.비즈니스 도메인은 동일한 데이터를 사용할 수 있지만 기술적 요구 사항이 서로 충돌하는 경우 문제를 분리하는 것이 좋습니다.예를 들어 특정 비즈니스 작업이 데이터를 집중적으로 집계해야하며 다른 하나는 개별 레코드 만 빠르게 선택 해야하는 경우 우려를 분리하는 것이 좋습니다.유연성에 대해서도 동일하게 적용될 수 있습니다.하나의 사용 사례는 일상적인 변화가 필요할 수 있으며, 다른 하나는 적어도 1/4 이상 안정적으로 유지되어야합니다.다시 말하지만, 당신은 문제를 분리하는 것을 고려해야합니다.따라서 DDS 경계 내에서 인스턴스가 허용되는 방식으로 DDS를 분리했습니다.
내부적으로 데이터 조직의 이야기는 도메인이 더 크고 여러 하위 도메인으로 구성 될 때 더 복잡해질 수 있습니다. 이보기의 DDS는 더 많은 초록입니다. 인스턴스 및 영역은 여러 하위 도메인간에 공유 될 수 있으며 영역은 독점적 일 수 있습니다. 이 콘크리트를 예로 만들어 보겠습니다. 큰 도메인의 경우 하나의 DDS의 모든 다양한 영역 주위에 경계를 줄 수 있습니다. 예를 들어,이 DDS 내에서 첫 번째 두 영역은 여러 하위 도메인간에 공유 될 수 있습니다. 그러므로 모든 하위 도메인에 대해 닦고, 수정하고, 과거 데이터를 빌드하는 것은 일반적으로 수행됩니다. 변형을 위해서는 데이터가 하위 도메인 또는 유스 케이스에 특정되어야하기 때문에 이야기가 더욱 복잡 해집니다. 그래서 하나의 사용 사례에만 해당하는 공유 및 파이프 라인이있는 파이프 라인이있을 수 있습니다. 모든 파이프 라인을 포함하여 전체 데이터 체인은 함께 속하므로 하나의 거대한 DDS 구현으로 볼 수 있습니다. 이 거대한 DDS 구현 내부에서 방금 배운 것처럼 다른 경계 : 모든 하위 도메인 및 특정 경계에 대한 일반적인 경계를 볼 수 있습니다.
도메인을 분해하는 것은 도메인이 더 크거나 하위 도메인이 일반 반복 가능 – 통합 로직을 요구할 때 특히 중요합니다.이러한 상황에서는 다른 하위 도메인을 표준화하고 이익을 얻을 수있는 방식으로 통합 논리를 제공하는 일반적인 하위 도메인을 가질 수 있습니다.지상 규칙은 서브 도메인간에 공유 모델을 소형화하고 항상 유비쿼터스 언어로 정렬하는 것입니다.겹침에 대해서는 도메인 중심 디자인에서 다른 패턴을 사용합니다.
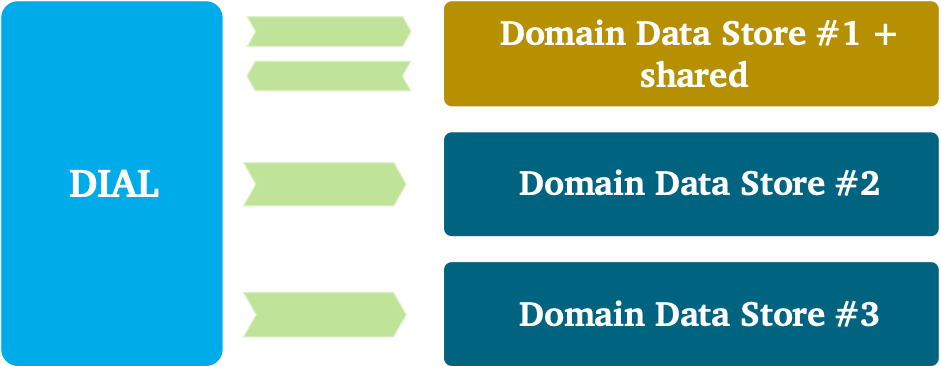
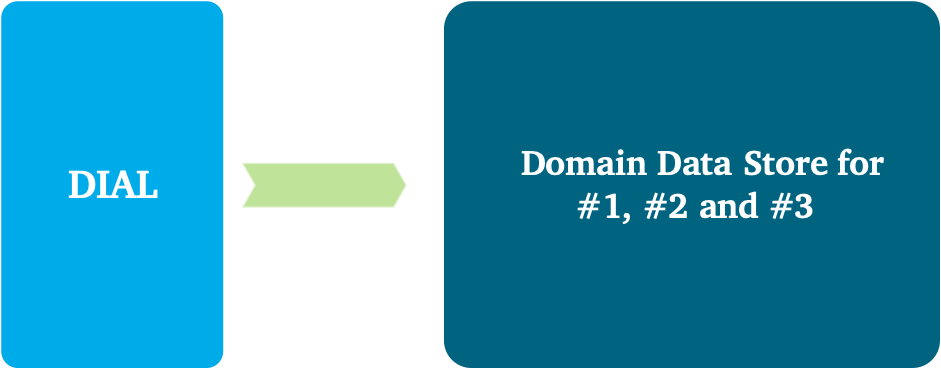
데이터 요구 사항이 겹치는 세 가지 예시적인 사용 사례를 상상해보십시오.다른 통합 및 배포 패턴은 다른 팀 내에 적용될 수 있습니다.적용 할 수있는 다른 접근 방식을 탐험 해보자.
그만큼별도의 방법패턴은 재사용 가능성보다 복제 비용이 선호되는 경우에 사용할 수 있습니다.이 패턴은 일반적으로 높은 유연성과 민첩성이 필요할 때 선택입니다.모델링 관점에서 공통적이거나 아무 것도 공통적으로있을 때도 선택할 수 있습니다.
팀은 사용을 사용할 수 있습니다협력 관계겹치는 모든 당사자의 공유 개발 요구 사항을 수용 할 수있는 패턴은 큽니다.모든 팀은 서로 협조하고 서로의 요구를 고려해야합니다.각자는 공유 로직을 자유롭게 변경할 수 없기 때문에 모든 사람들에게 큰 공약이 필요합니다.이 접근 방식에서 데이터 엔지니어링 팀은 데이터 소비자와 제공 업체 모두 데이터 저장소에 캡처, 추출 및로드 및 다시 게시하거나 배포합니다.
ㅏ고객 공급 업체한 팀이 강하고 하류 소비자의 데이터와 필요에 대한 소유권을 갖는 경우 패턴을 사용할 수 있습니다.이 패턴의 단점은 상충되는 문제가 될 수 있으며, 다운 스트림 팀이 산출물을 협상하고 우선 순위를 일정하도록 강요 할 수 있습니다.
ㅏ적합성패턴은 모든 요구 사항에 완전히 모든 당사자를 준수하는 데 사용할 수 있습니다.이 패턴은 통합 작업이 매우 복잡하거나 다른 당사자가 제어를 허용하거나 공급 업체 패키지를 사용할 수있는 경우 선택할 수 있습니다.
결론
이 장에 건설 된 아키텍처는 데이터 집약적 인 응용 프로그램을 규모에서 관리하는 방법을 이해하는 데 도움이됩니다.가치가 빠른 시간을 달성하기 위해 도메인 경계를 사용하여 데이터를 분해하는 것이 중요합니다.사일로를 부수고 DDS간에 의존성을 최소한으로 유지함으로써 팀이 집중할 수 있습니다.
이 BlogPost에서 토론 한 아키텍처는 초정표에서 데이터를 관리하는 데 도움이됩니다.더 많은 것을 배우고 싶다면, 나는 당신에게 책을 살펴 보도록 참여시킵니다.저울 데이터 관리…에
Smashing silos with Domain Data Stores
Smashing silos with Domain Data Stores
In my other posts you learned how ABN AMRO makes data available in a data mesh style architecture. In this blogpost you will learn about how to break big data monoliths apart.
Data-driven decision-making shift
In the years since data warehouses became a commodity, much has changed. Distributed systems have gained great popularity, data is larger and more diverse, new database designs have popped up, and the advent of cloud has separated compute and storage for increased scalability and elasticity. Combine these trends with the shift from centralized to domain-oriented data ownership, and you will immediately understand the importance of changing the way data-intensive applications must be designed.
In our data architecture we made a clear split between direct data consumption and creation of new data. In the data distribution architecture, as you can read here and here, we have positioned Read Data Stores (RDS) to capture and serve out larger volumes of immutable data repeatedly to consumers. In this pattern, data is read but no new data is created. Consuming applications or users use the RDSs directly as their data sources and might perform some lightweight integration based on mappings between similar data elements. The big benefit of this model is that it does not require data engineering teams creating and maintaining new data models. You don’t extract, transform, and load data into a new database. Transformations happen on the fly, but these results don’t need a permanent new home. This approach is particular useful for data exploration, lightweight reporting and simple analytical models that don’t require complex data transformation.
The problem, however, is that the consumers’ needs can exceed what RDSs offer. In some cases, there is a clear need for new data creation: for example, complex business logic followed by analytical models that generate new business insights. To preserve these insights for later analysis, you need to retain this information somewhere, for example, in a database. Another situation can be that the amount of data that needs to be processed exceeds what the RDS platform can handle. In such a case, the amount of data processing; for example, of historical data, is so intense that you would be justified in incrementally bringing data over to a new location, processing it, and pre-optimizing it for later consumption. One more situation would be when multiple RDSs need to be combined and harmonized. This typically requires orchestrating many tasks and bringing data together. Making users wait until all of these tasks are finished will negatively affect user experience. These implications bring us to the second pattern of data consumption: creating Domain Data Stores (DDSs).
Domain Data Stores
We want to manage newly created data more carefully, while at the same time increasing agility. This is what DDSs are positioned for. This type of application has the role to intensively process data, store the newly created data, and facilitate the consumer’s use case. To unlock the value at large, we have designed a new architecture, which includes a platform for data engineering teams. Let’s look side and evaluate the characteristics.
What we envision is an ecosystem that allows rapid delivery of new data-driven decision use cases. It facilitates data engineering and intensive processing at large, while staying in control and not seeing a proliferation of technologies. We foresee a shift from generic (enterprise) data integration towards business specific data creation; a shift from integration specialists to community building and seamless collaboration; and a shift from rigid data models toward more flexible or “schema-light” approaches.
At high-level the ecosystem looks like Figure 1 above; a fully managed platform that allows fast data ingestion, transformation and usage. At the bottom, you see managed infrastructure, which main goal is to hide away complexity from all data engineering teams. There are reusable functions to support data engineering teams in a self-service manner. These include reusable and managed database technologies, central monitoring and logging, lineage, identity and access management, orchestration, CI/CD, data and schema versioning, patterns for batch-, API- and event-based ingestion, integration with business intelligence and advanced analytics capabilities, and so on. The underpinning platform is managed using a Team Topologies approach: a central platform team manages the underlying platform, while supporting all other teams. The main purpose is to simplify all services, governing and securing the platform and with that reducing the overhead for data engineering teams.
On top, you see DDSs in which data is managed by the data engineering teams. These domain teams focus on either data products, customer journeys or business use cases. The boundaries around DDSs also determine data responsibilities. These include data quality, ownership, integration and distribution, metadata registration, modeling, and security. I’ll come back to the granularity and domain boundaries later.
For the functional requirements, we ensure business objectives and goals are well-defined, detailed, and complete. Understanding them is the foundation for your solution and requires you to clarify the criteria for what business problems need to be solved, what data sources are required, what solutions need to be operational, what data processing must be performed in real time or offline, what the integrity and requirements are, and what out‐ come is subject to reuse by other domains.
For the non-functional requirements, we made choices about how many and what type of data store technologies are offered. You can think of a common set of reusable database technologies or data stores and patterns to ensure leveraging the strength of each data store. For example, mission-critical and transitional applications might only be allowed to go with strong consistency models, or business intelligence and reporting might only be allowed with stores that provide fast SQL access.
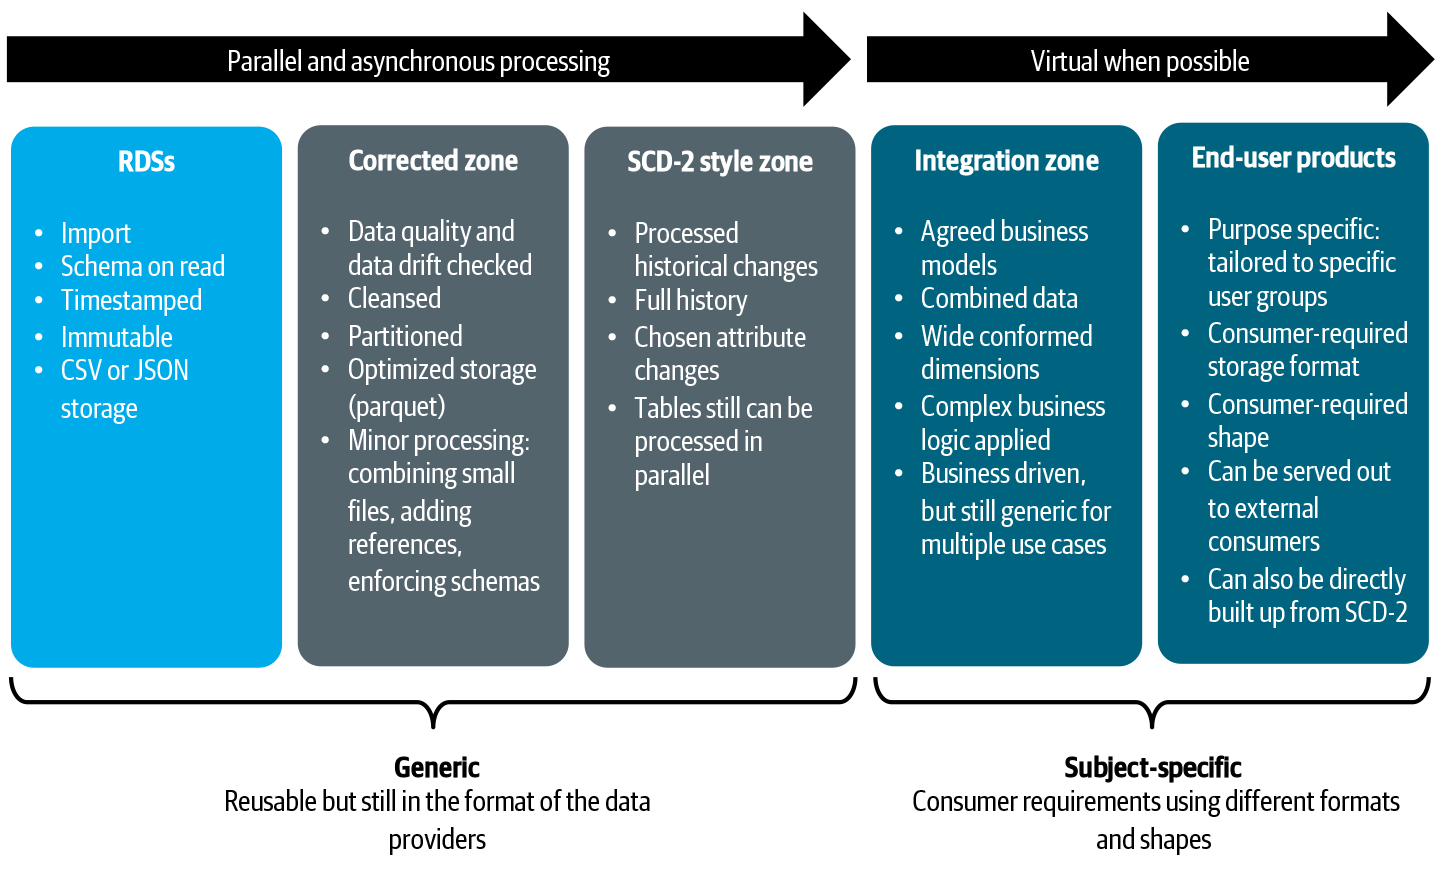
Different data stores manage and organize their data internally. One common way of organizing is to separate (either logically or physically) the concerns of ingesting, cleansing, curating, harmonizing, serving, and so on. Within our domain data stores, we encourage using various zones with different storage techniques, such as folders, buckets, databases, and the like. Zones also allow us to combine purposes, so a store can be used to facilitate operations and analytics at the same time. For all stores and zones, the scope must be very clear.
For the data models, we encourage to shift away from rigid data models toward more “schema-light” approaches. However, any architectural style is allowed. If teams embrace schema-on-read or prefer directly building up simple dimensional models, we encourage them to do so. Kimball, or Data Vault modeling can be also applied. It all depends on the needs and size of the use case, which brings me to the next subject.
Domain Data Store Granularity
When we transition away from our enterprise data warehouses into more fine-grained DDS designs, we need to consider the granularity and logically segment our data. Determining the scope, size, and placement of logical DDS boundaries is difficult and causes challenges when distributing data between domains. Typically, the boundaries are subject-oriented and aligned with business capabilities. When defining the logical boundaries of a domain, there is value in decomposing it into subdomains for ease of data modelling activities and internal data distribution within the domain.
The important task is to think carefully about the logical role of your DDS. This covers as well the business granularity and technical granularity:
- The business granularity starts with a top-down decomposition of the business concerns: the analysis of the highest-level functional context, scope (i.e., ‘boundary context’) and activities. These must be divided into smaller ‘areas’, use cases and business objectives. This exercise requires good business knowledge and expertise on how to divide efficiently business processes, domains, functions etc. The best practice is to use business capabilities as a reference model, study common terminology (ubiquitous language) and overlapping data requirements.
- The technical granularity is performed towards specific goals such as: reusability, flexibility (easy adaptation to frequent functional changes), performance, security and scalability. The key point of balance is about making the right trade-offs. A business domain might use the same data, but if the technical requirements are conflicting with each other it might be better to separate the concerns. For example, if one specific business task needs to intensively aggregate data, and another one only quickly selects individual records, it can be better to separate the concerns. The same might apply for flexibility. One use case might require daily changes, the other one must remain stable for at least a quarter. Again, you should consider separating the concerns. Therefore, we decomposed DDSs in such a way that instances are allowed within a DDS boundary.
The story of organizing data internally can become more complex when a domain is larger and composed of several subdomains. The DDS in this view is more abstract: instances and zones can be shared between multiple subdomains, and zones can be exclusive. Let me try to make this concrete with an example. For a large domain, you could plot a boundary around all the various zones of one DDS. Within this DDS, for example, the first two zones can be shared between multiple subdomains. So cleaning, correcting, and building up historical data is commonly performed for all subdomains. For the transformation, the story becomes more complex because data is required to be specific for a subdomain or use case. So, there can be pipelines that are shared and pipelines that are solely specific to one use case. This entire chain of data, including all of the pipelines, belong together and thus can be seen as one giant DDS implementation. Inside this giant DDS implementation, as you just learned, you see different boundaries: boundaries that are generic for all subdomains and boundaries that are specific.
Decomposing a domain is especially important when a domain is larger, or when subdomains require generic — repeatable — integration logic. In such situations it could help to have a generic subdomain that provides integration logic in a way that allows other subdomains to standardize and benefit from it. A ground rule is to keep the shared model between subdomains small and always aligned on the ubiquitous language. For the overlap, we use different patterns from domain-driven design.
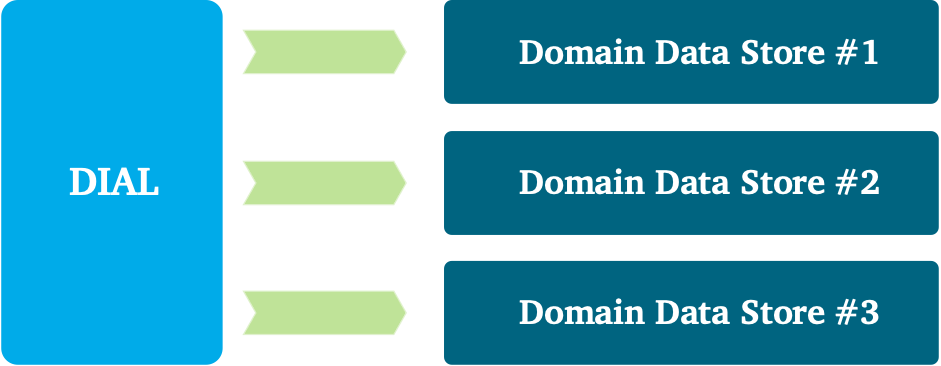
Imagine three illustrative use cases in which data requirements overlap. Different integration and distribution patterns can be applied within and across the different teams. Let’s explore which different approaches you can apply.
The separate ways pattern can be used if the associated cost of duplication is preferred over reusability. This pattern is typically a choice when high flexibility and agility are required. It can also be a choice when little or nothing is in common from a modeling perspective.
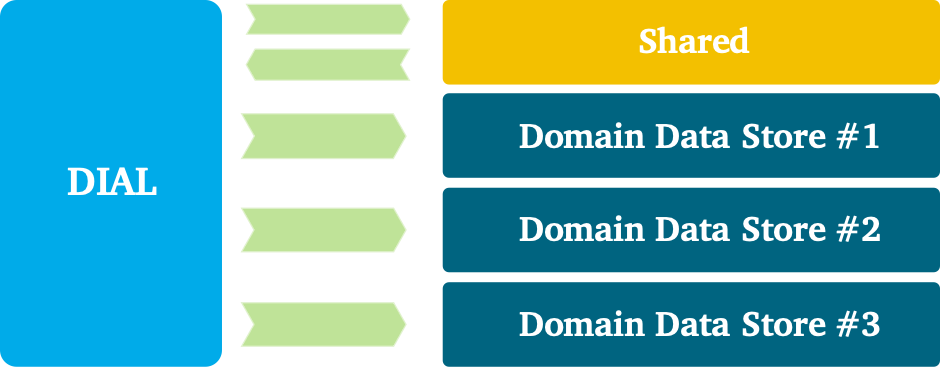
Teams can work use a partnership pattern to accommodate the shared development needs of all parties when overlap is large. All teams must be willing to cooperate with and regard each other’s needs. A big commitment is needed from everybody, because each cannot change the shared logic freely. Data engineering teams, in this approach, are both data consumers and providers: they capture, extract and load it into data stores, and republish or distribute it.
A customer-supplier pattern can be used if one team is strong and willing to take ownership of the data and needs of downstream consumers. The drawbacks of this pattern can be conflicting concerns, forcing downstream teams to negotiate deliverables and schedule priorities.
A conformist pattern can be used to conform all parties entirely to all requirements. This pattern can also be a choice when the integration work is extremely complex, no other parties are allowed to have control, or when vendor packages are used.
Conclusion
The architecture that we have been building throughout this chapter helps you to understand how we manage data-intensive applications at scale. You’ve seen that to achieve a faster time to value, it’s important to decomposition data using domain boundaries. By smashing silos and keeping dependencies between DDSs to a minimum, we let teams stay focused.
The architecture that we discussed throughout this blogpost helps us manage data at scale. If you are curious to learn more, I engage you to have a look at the book Data Management at Scale.