Tableau’s relationships are pretty cool
Unlike joins, relationships preserve the native granularity of data, reducing the need for LOD expressions.
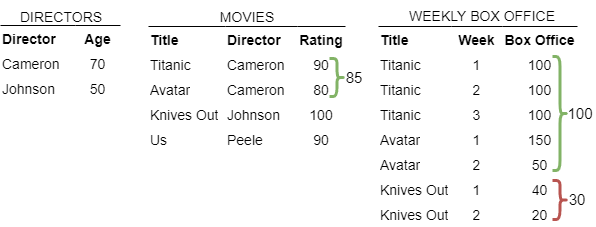
Last summer, Tableau introduced a new way of combining data. It is called relationships. The old way of combining data using joins is still available, and I imagine that many of us might stick with the familiar joins for a while. However, relationships have much to recommend them and this post will show some of their ins and outs. Consider the three tables below:

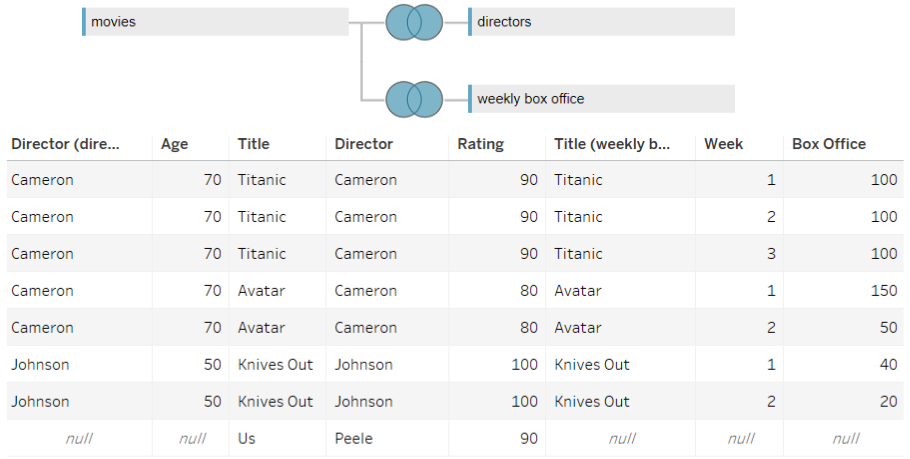
Using joins Tableau would combine these tables into one flat file like this:

Joining tables with different levels of granularity duplicates observations in tables with more aggregate levels of granularity — in this case, director and ratings tables. Correctly summarizing measures from these tables requires using LOD expressions which can be challenging.
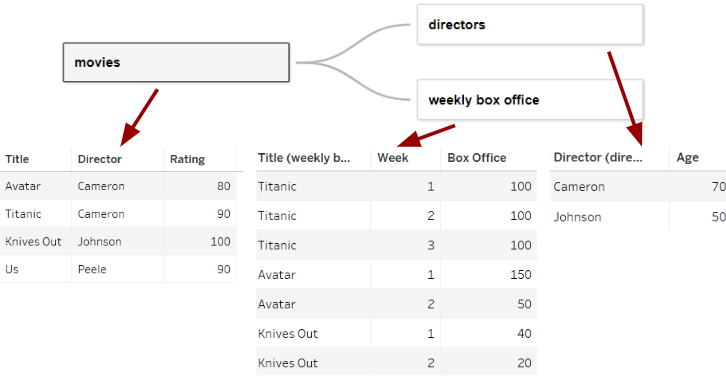
Relationships preserve the native level of granularity of each table. Users merely define how tables are related and joins are performed as needed.

When we create summaries that involve measures from these tables, each measure is summarized using its native level of granularity.

The average age of our two directors is 60 — never mind that James Cameron has five weekly box office entries and Rian Johnson only two. Since age comes from the directors table whose native granularity is director, the average is calculated across directors. This is natural to anyone new to Tableau, but to those of us used to using LOD expressions to correct for duplication, and used to thinking of our data as one joined flat file, this is rather revolutionary.
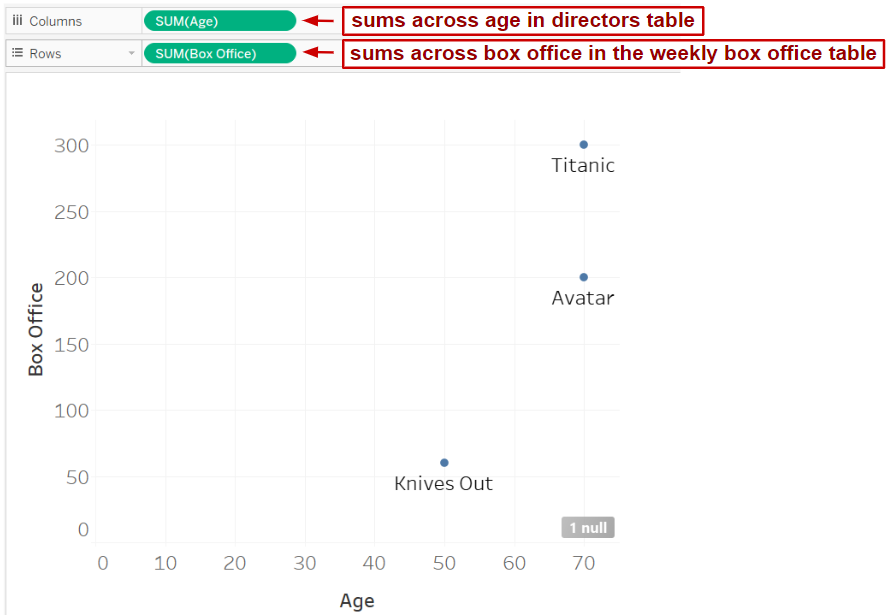
Let’s illustrate that idea again in the scatter plot below. We are plotting director’s age against sum of box office by movie. Tableau adds up box office revenue for each movie from the box office table, but it takes director’s age from the director’s table and since each director is in that table only once, age does not get duplicated.

Notice also that with relationships we don’t have to worry about whether to use right, left, full or inner join. If a dimension exists in any of the tables used in the view, the dimension is included in the viz. There are no nulls generated for measures of dimensions that are present in one table but not another.
Another change that comes with relationships is the disappearance of the Number of Records field. Now, there is a (count) field associated with each table. This makes sense since each table preserves its level of granularity and thus has its own number of records.
Relationships are not perfect. At the moment, they don’t support calculation “joins”, i.e. it is impossible to define a relationship based on a calculation. This means that any operations required for establishing a relationship, such as splitting a field or splicing two fields, need to be done prior to connecting to the source. Let’s hope that Tableau builds calculations into relationships soon.
It is also worth noting that data source filters extend across related tables. You may think that the tables are kept separate but that is not the case: a filter on values in one table will apply to matching values in related tables. For example, adding a filter to include only directors who are 50 years old, excludes not just James Cameron from the directors table but also all of his movies from the movies table. (It also excludes Jordan Peele’s Us unless we specify to include nulls.)
Tableau does a great job explaining relationships here. While it takes some getting used to the logic of relationships they are definitely worth a try.

